




Last updated: 27 August 2026
Current data window: 10 September 2025 to 27 August 2026
Wedding planning is often discussed through assumptions.
People say Nigerian weddings are always enormous, couples leave vendor bookings until the last minute, photographers receive the most enquiries, and almost every serious wedding opportunity is in Lagos.
Some of these assumptions contain an element of truth. Others become far more nuanced when they are tested against actual requests from people planning weddings and related celebrations.
This living report analyses 1,284 requests published on Marriage In Nigeria, covering 8,348 individual service selections across 22 vendor categories.
The findings provide a detailed view of current wedding demand trends on the platform: what services people request, how many vendors they need, where their events are taking place, how much they say they have available, how many guests they expect, how far ahead they plan and how they prefer vendors to contact them.
The clearest overall picture is this:
Wedding demand on Marriage In Nigeria is venue-led, multi-service, locally focused, message-driven and usually initiated several months before the event.
These findings can help couples plan more realistically, help vendors shape better offers and help the wider wedding industry understand how demand develops before an event takes place.
The Current Picture at a Glance
| Indicator | Current finding |
|---|---|
| Published requests analysed | 1,284 |
| Individual service selections | 8,348 |
| Vendor service categories represented | 22 |
| Average services selected per request | 6.5 |
| Median services selected per request | 4 |
| Requests involving more than one service | 70.0% |
| Most frequently selected service | Venue |
| Requests asking for venue suggestions | 71.2% |
| Median usable guest count | 200 guests |
| Median positive stated budget | ₦2,000,000 |
| Median planning lead time | 127 days |
| Events scheduled for Saturdays | 71.2% |
| Preference for vendors within the city or state | 98.2% |
| Preference for Chat or WhatsApp contact | 94.1% |
These figures immediately challenge the idea that most people visit a wedding platform looking for only one vendor.
While targeted enquiries do occur, most published requests involve several services. Many requesters appear to be assembling substantial portions of their wedding team rather than replacing one missing supplier.
How to Read This Report
This report measures activity within the Marriage In Nigeria request marketplace. It should not be interpreted as a census of every wedding taking place in Nigeria.
Several principles are important when interpreting the findings:
- A published request is a planning brief, not necessarily a completed wedding or confirmed booking.
- One request can include several services, so service percentages overlap and should not be added together.
- Budgets are amounts stated by requesters. They are not verified final expenditure.
- A stated total budget may cover only the services included in the request rather than the entire wedding.
- Location figures describe events represented on Marriage In Nigeria, not the total number of weddings held in each state.
- Monthly activity can be influenced by platform growth, marketing, awareness and vendor acquisition.
- A request being closed does not prove that a vendor was booked.
- The report will change as more requests are published.
The purpose is not to make exaggerated industry-wide claims. It is to identify reliable patterns within the growing body of demand data available on Marriage In Nigeria.
1. Published Request Activity Has Accelerated
The first request in the current data window was published on 10 September 2025. By 27 August 2026, the platform had accumulated 1,284 published requests.
Monthly activity did not rise in a perfectly straight line, but publication volume increased considerably during 2026.
| Month | Requests published |
|---|---|
| September 2025 — from the 10th | 46 |
| October 2025 | 35 |
| November 2025 | 29 |
| December 2025 | 52 |
| January 2026 | 85 |
| February 2026 | 68 |
| March 2026 | 88 |
| April 2026 | 99 |
| May 2026 | 155 |
| June 2026 | 147 |
| July 2026 | 200 |
| August 2026 — through the 27th | 280 |
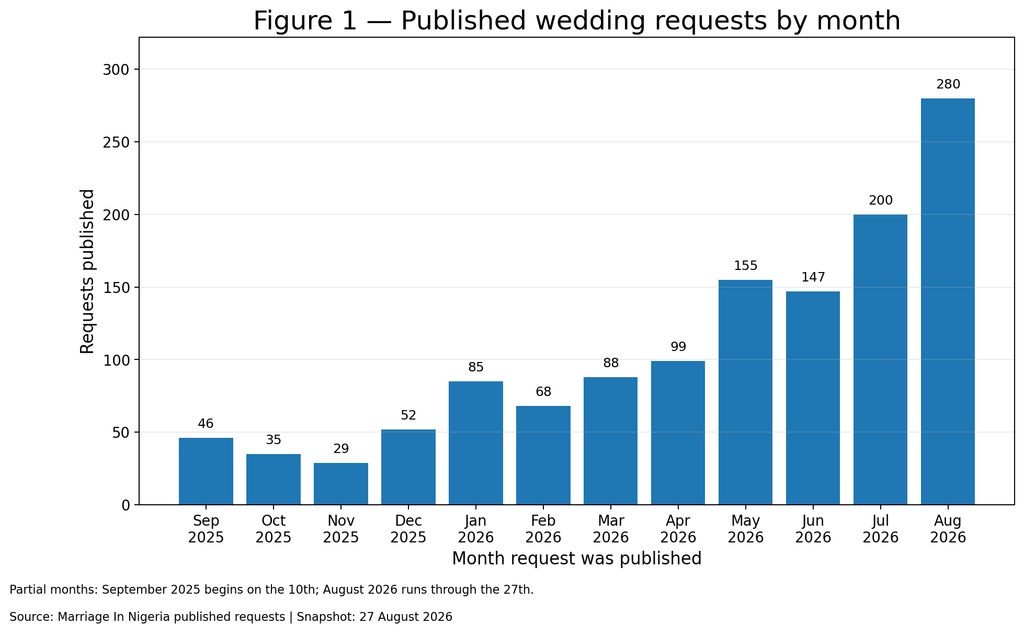
A total of 782 requests were published between May and 27 August 2026. That represents 60.9% of every request in the current report.
July reached 200 published requests, while August had already reached 280 before the end of the month.
This should not be interpreted as proof that the number of weddings across Nigeria suddenly increased by the same proportion. The growth can also reflect:
- Greater awareness of the platform
- Increased social media reach
- More couples and event planners discovering the request feature
- Improved vendor coverage
- Marketing and acquisition activity
- Repeat usage and recommendations
The correct conclusion is that request activity on Marriage In Nigeria has accelerated, creating a larger and increasingly useful pool of observable planning behaviour.
As the report is updated, a longer time series will make it possible to distinguish platform growth from recurring seasonal patterns.
2. White, Traditional and Combined Weddings Dominate Demand
Three event types account for most published requests:
| Event type | Requests | Share of all requests |
|---|---|---|
| White Wedding | 528 | 41.1% |
| Traditional Wedding | 299 | 23.3% |
| White and Traditional Wedding | 229 | 17.8% |
| Other | 67 | 5.2% |
| Engagement or Introduction | 52 | 4.0% |
| Walima or Nikah | 37 | 2.9% |
| Court Wedding | 27 | 2.1% |
| Ceremony | 25 | 1.9% |
| After-Party | 14 | 1.1% |
| Wedding | 5 | 0.4% |
| Party | 1 | 0.1% |
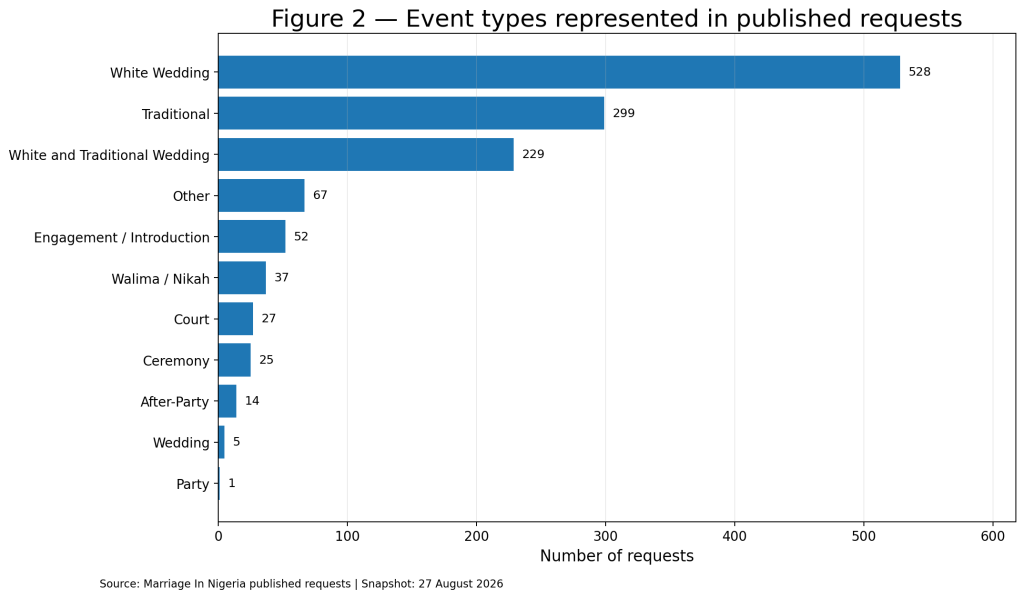
White weddings, traditional weddings and combined white-and-traditional weddings collectively account for 1,056 requests, or 82.2% of the total.
Looking at the categories another way:
- 757 requests, or 58.9%, explicitly included a white wedding, whether alone or alongside a traditional wedding.
- 528 requests, or 41.1%, explicitly included a traditional wedding, whether alone or alongside a white wedding.
This reinforces the importance of maintaining a wedding marketplace that understands both contemporary and culturally rooted celebrations.
A vendor serving the Nigerian wedding market may need to understand that the requirements of a traditional wedding can differ substantially from those of a white wedding. Differences may affect attire, entertainment, ceremony coordination, food, venue design, family participation, photography, music and the involvement of culturally specific professionals such as an Alaga or Alaga Ijoko.
The smaller categories also matter. Engagements, introductions, Walima or Nikah ceremonies, court weddings, after-parties and other celebrations collectively represent a meaningful part of the marketplace.
They show that wedding demand does not begin and end with one ceremony. A single couple may need services across several connected events.
3. Venue Is the Most Requested Wedding Service
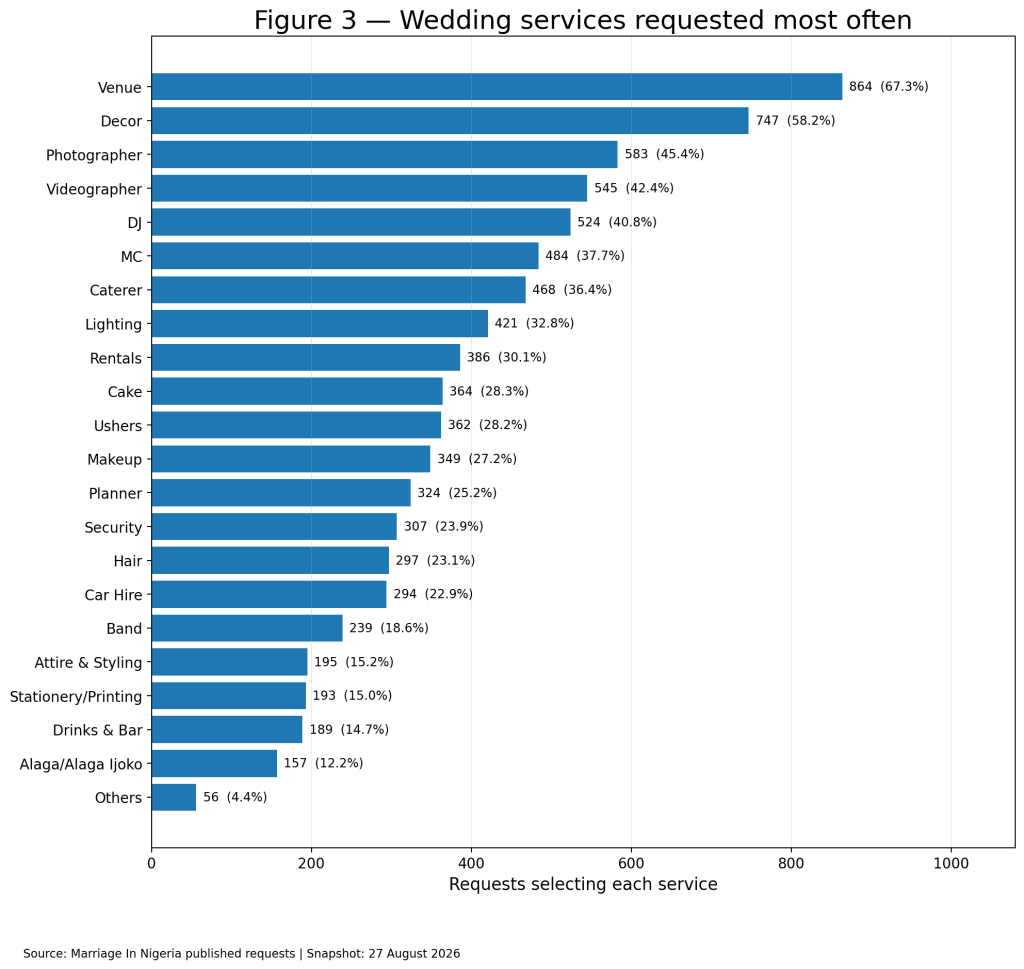
Venue is the most frequently selected service by a wide margin.
It appeared in 864 requests, representing 67.3% of all published requests.
Decor followed with 747 requests, while photography, videography, DJs, MCs and catering formed the next major group.
| Rank | Service | Requests | Share of all requests |
|---|---|---|---|
| 1 | Venue | 864 | 67.3% |
| 2 | Decor | 747 | 58.2% |
| 3 | Photographer | 583 | 45.4% |
| 4 | Videographer | 545 | 42.4% |
| 5 | DJ | 524 | 40.8% |
| 6 | MC | 484 | 37.7% |
| 7 | Caterer | 468 | 36.4% |
| 8 | Lighting | 421 | 32.8% |
| 9 | Rentals | 386 | 30.1% |
| 10 | Cake | 364 | 28.3% |
| 11 | Ushers | 362 | 28.2% |
| 12 | Makeup | 349 | 27.2% |
| 13 | Planner | 324 | 25.2% |
| 14 | Security | 307 | 23.9% |
| 15 | Hair | 297 | 23.1% |
| 16 | Car Hire | 294 | 22.9% |
| 17 | Band | 239 | 18.6% |
| 18 | Attire and Styling | 195 | 15.2% |
| 19 | Stationery and Printing | 193 | 15.0% |
| 20 | Drinks and Bar | 189 | 14.7% |
| 21 | Alaga or Alaga Ijoko | 157 | 12.2% |
| 22 | Others | 56 | 4.4% |
Venue demand goes beyond selecting the venue category
The request form also asks whether the requester needs venue suggestions.
A total of 914 requesters, or 71.2%, said they needed venue suggestions.
The relationship between selecting Venue as a service and asking for suggestions is especially revealing:
| Venue position | Requests | Share |
|---|---|---|
| Selected Venue and requested venue suggestions | 794 | 61.8% |
| Did not select Venue but requested venue suggestions | 120 | 9.3% |
| Selected Venue but did not request venue suggestions | 70 | 5.5% |
| Neither selected Venue nor requested suggestions | 300 | 23.4% |
More than six in ten published requests both selected Venue and explicitly asked for help finding one.
Another 120 requesters asked for venue suggestions without selecting Venue as a service. Some may have viewed venue recommendations as planning support rather than a standalone vendor category.
Only 70 selected Venue while saying they did not need suggestions. These requesters may already have had a specific venue in mind but still required quotation, availability or booking assistance.
Why venue functions as a gateway service
Venue selection affects many subsequent decisions:
- The number of guests that can be accommodated
- Whether the ceremony and reception can be held in one place
- Decor possibilities and restrictions
- Lighting requirements
- Furniture and rental needs
- Catering access
- Parking and transport arrangements
- Security requirements
- Sound restrictions
- Power supply
- Vendor access and setup time
- Accommodation for guests
- Distance from the couple, families and place of worship
Venue is therefore not merely another item on a wedding checklist. For many requesters, it is the decision around which the rest of the event must be organised.
This presents a strong opportunity for venues listed in the Marriage In Nigeria wedding vendor directory, but it also creates opportunities for planners and other vendors who can help couples evaluate venue suitability rather than merely recommend a popular hall.
4. Most Requests Involve Several Wedding Services
The 1,284 requests contained 8,348 service selections.
That produces an average of 6.5 services per request, although the median was lower at four services. The difference between the average and median reflects the presence of many broad requests containing ten or more services.
| Number of services in the request | Requests | Share |
|---|---|---|
| 1 service | 385 | 30.0% |
| 2–3 services | 201 | 15.7% |
| 4–6 services | 167 | 13.0% |
| 7–10 services | 193 | 15.0% |
| 11–15 services | 208 | 16.2% |
| 16 or more services | 130 | 10.1% |
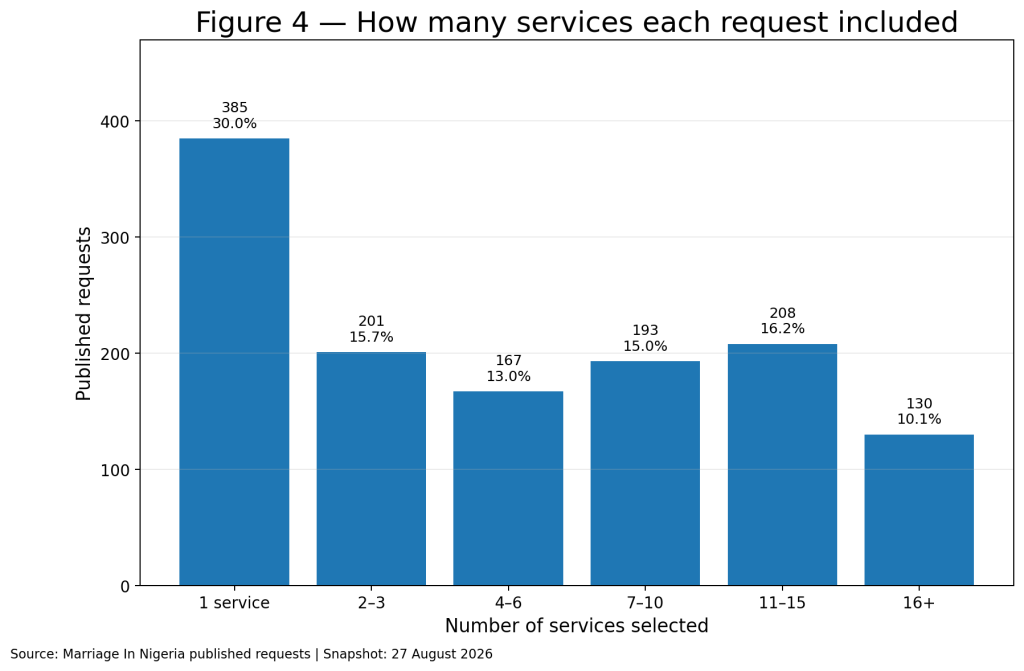
The figures reveal three important patterns.
Seventy per cent of requests are multi-service
A total of 899 requests, or 70.0%, included at least two services.
This means the dominant use case is not simply “find me one photographer” or “find me one makeup artist.” Most requesters are trying to solve several planning needs at once.
More than one-quarter are broad wedding briefs
A total of 338 requests, or 26.3%, selected at least 11 services.
Within this group, 130 requests selected 16 or more services.
These are effectively broad wedding-team briefs. They create opportunities for:
- Full-service wedding planners
- Vendor collectives
- Coordinated packages
- Trusted referral partnerships
- Venues with preferred-vendor networks
- Vendors capable of managing subcontractors
- Platforms that can organise several quotations in one place
Venue accounts for most single-service requests
Of the 385 single-service requests, 232 were venue-only requests.
That means venue accounted for 60.3% of all single-service requests.
Once venue-only requests are removed, only 153 requests—or 11.9% of the entire dataset—were targeted requests for one non-venue service.
This further reinforces the position of venue as a distinct discovery challenge. Other wedding services are much more likely to be requested as part of a broader group.
5. Certain Wedding Services Consistently Travel Together
The most common service combinations reveal how requesters mentally group different parts of their event.
| Rank | Service combination | Requests containing both | Share of all requests |
|---|---|---|---|
| 1 | Decor and Venue | 531 | 41.4% |
| 2 | Photographer and Videographer | 528 | 41.1% |
| 3 | Decor and Photographer | 471 | 36.7% |
| 4 | Decor and Videographer | 452 | 35.2% |
| 5 | DJ and Decor | 439 | 34.2% |
| 6 | Photographer and Venue | 422 | 32.9% |
| 7 | DJ and MC | 415 | 32.3% |
| 8 | Decor and MC | 404 | 31.5% |
| 9 | Venue and Videographer | 402 | 31.3% |
| 10 | DJ and Photographer | 396 | 30.8% |
| 11 | Caterer and Decor | 394 | 30.7% |
| 12 | DJ and Venue | 390 | 30.4% |
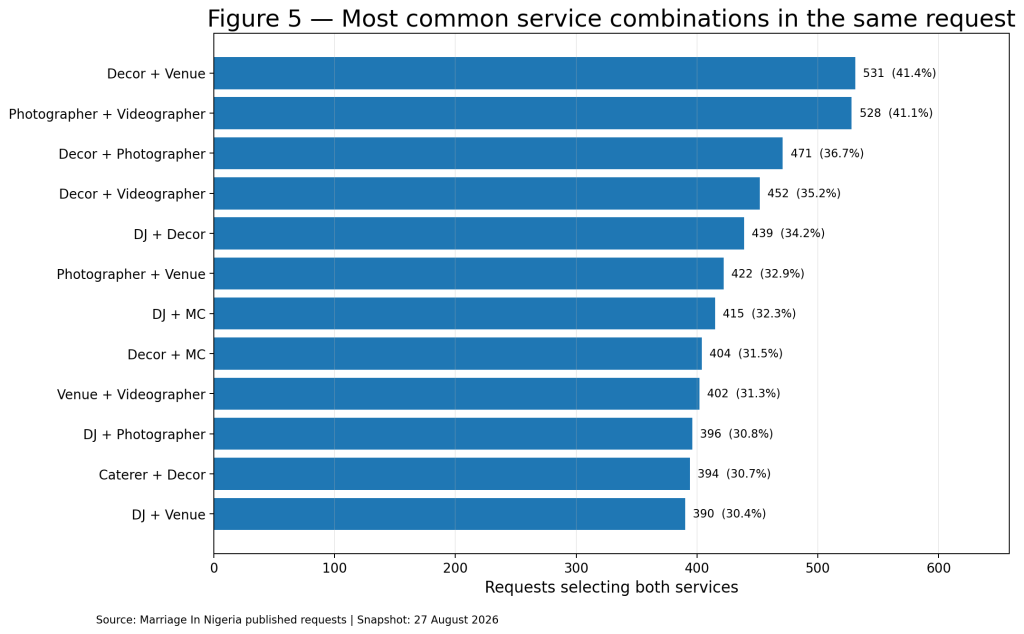
Broad requests containing many services naturally increase the frequency of several combinations. Even with that caveat, some pairings are unusually strong.
Photography and videography are almost inseparable
Photography and videography appeared together in 528 requests.
Among all requests selecting a photographer:
- 90.6% also selected a videographer.
Among requests selecting a videographer:
- 96.9% also selected a photographer.
For many requesters, photography and videography are not two independent decisions. They form one documentation requirement.
This supports joint packages, referral arrangements and teams capable of coordinating coverage without competing for angles, timelines or access.
DJs and MCs form an entertainment-and-flow package
DJ and MC appeared together in 415 requests.
- 79.2% of DJ requests also included an MC.
- 85.7% of MC requests also included a DJ.
The pairing makes practical sense. The DJ handles music and sound progression, while the MC manages attention, transitions, announcements and audience engagement.
Vendors in either category can benefit from reliable referral relationships with the other.
Hair and makeup are strongly connected
Hair and Makeup appeared together in 248 requests.
- 83.5% of Hair requests also included Makeup.
- 71.1% of Makeup requests also included Hair.
The relationship creates room for coordinated beauty teams and clearly structured bridal packages covering trials, the bride, bridesmaids and family members.
Lighting is usually part of a decor requirement
Decor and Lighting appeared together in 390 requests.
- 92.6% of Lighting requests also included Decor.
- 52.2% of Decor requests also included Lighting.
This asymmetry is instructive. Lighting is rarely treated as an isolated need. It is normally part of the visual environment being created by the decorator.
Decorators who do not provide lighting directly may benefit from formal technical-lighting partnerships.
Rentals are closely connected to venue
Venue and Rentals appeared together in 330 requests.
- 85.5% of Rentals requests also included Venue.
- 38.2% of Venue requests included Rentals.
Some venues provide furniture, tents, staging, tableware or decorative infrastructure. Others require the couple to source these separately.
The data suggests that rental companies should make venue compatibility, delivery coverage, installation and pickup terms very clear.
Security and ushers also form an operational pair
Security and Ushers appeared together in 219 requests.
- 71.3% of Security requests also included Ushers.
- 60.5% of Usher requests also included Security.
Both services contribute to guest movement, access control, order and the smooth running of the event.
This does not mean their responsibilities are interchangeable. It means couples often recognise both as part of the same event-operations layer.
The wider lesson for vendors
Many wedding services are bought as part of a system.
Vendors should therefore consider not only “Who are my competitors?” but also:
- Which services are usually needed before mine?
- Which services are usually requested alongside mine?
- Which vendors influence the client’s decision?
- Which partnerships can reduce planning friction?
- Can we present compatible packages without confusing responsibility?
- Can the client receive coordinated availability from several vendors?
The most useful collaborations are not necessarily between similar vendors. They are often between complementary vendors.
6. Lagos Leads Request Activity, but Demand Extends Across Nigeria
Lagos accounts for the largest share of event locations represented in the requests.
| Rank | State or FCT | Requests | Share |
|---|---|---|---|
| 1 | Lagos | 576 | 44.9% |
| 2 | Abuja — FCT | 170 | 13.2% |
| 3 | Rivers | 82 | 6.4% |
| 4 | Ogun | 69 | 5.4% |
| 5 | Oyo | 60 | 4.7% |
| 6 | Delta | 42 | 3.3% |
| 7 | Imo | 26 | 2.0% |
| 8 | Edo | 24 | 1.9% |
| 9 | Ondo | 24 | 1.9% |
| 10 | Kwara | 23 | 1.8% |
| 11 | Enugu | 22 | 1.7% |
| 12 | Anambra | 21 | 1.6% |
| 13 | Osun | 20 | 1.6% |
| 14 | Kaduna | 18 | 1.4% |
| 15 | Cross River | 15 | 1.2% |
| 16 | Abia | 14 | 1.1% |
| 17 | Akwa Ibom | 13 | 1.0% |
| 18 | Ekiti | 12 | 0.9% |
| 19 | Kogi | 9 | 0.7% |
| 20 | Plateau | 7 | 0.5% |
| 21 | Nasarawa | 6 | 0.5% |
| 22 | Bayelsa | 6 | 0.5% |
| 23 | Ebonyi | 5 | 0.4% |
| 24 | Kano | 5 | 0.4% |
| 25 | Benue | 4 | 0.3% |
| 26 | Niger | 3 | 0.2% |
| 27 | Sokoto | 3 | 0.2% |
| 28 | Bauchi | 2 | 0.2% |
| 29 | Borno | 2 | 0.2% |
| 30 | Taraba | 1 | 0.1% |
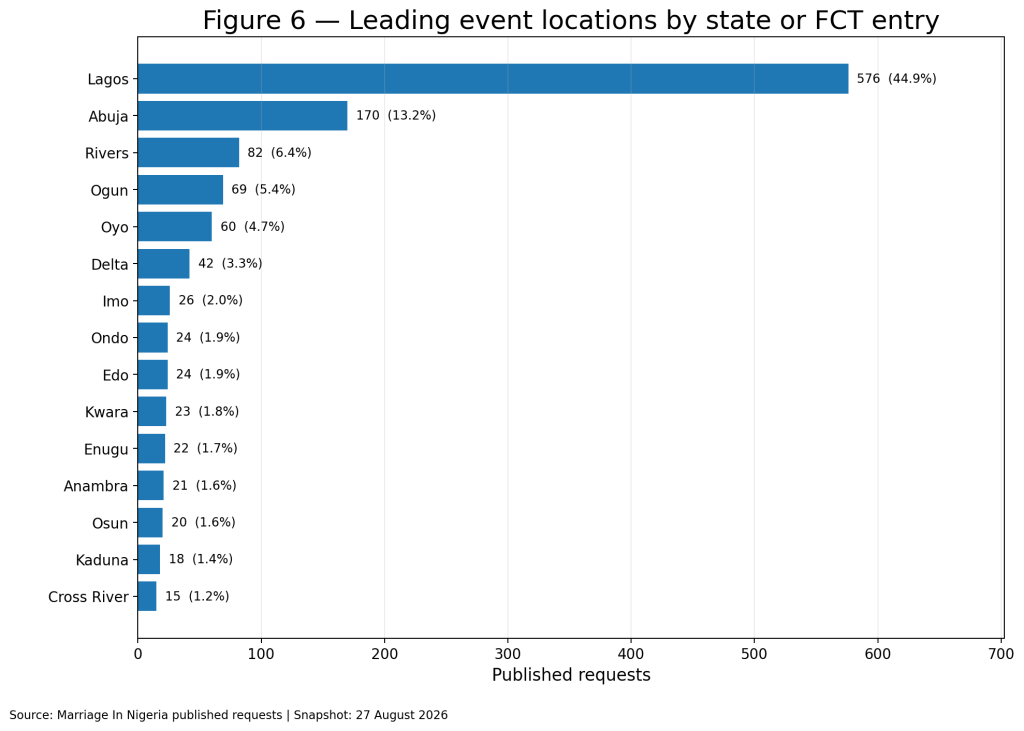
Lagos, Abuja and Rivers collectively account for 828 requests, or 64.5% of the total.
The top five locations—Lagos, Abuja, Rivers, Ogun and Oyo—account for 74.5%.
This concentration is significant, but it should be interpreted in the context of the platform’s current user acquisition, vendor coverage and awareness.
It does not mean that nearly half of all Nigerian weddings take place in Lagos. It means nearly half of the requests represented in this report concern events located in Lagos.
Thirty states or FCT entries are represented
The data includes event locations across 30 state or FCT entries.
At the current snapshot, no requests were represented from Adamawa, Gombe, Jigawa, Katsina, Kebbi, Yobe or Zamfara.
Their absence should not be interpreted as an absence of weddings or wedding demand. It may instead indicate areas where platform awareness, vendor representation or request acquisition remains limited.
Why the report focuses on states rather than cities
The city field contains 501 distinct free-text entries.
Frequently entered locations include Ikeja, Lagos, Port Harcourt, Abuja, Ibadan, Surulere, Ikorodu, Alimosho, AMAC, Akure, Warri and Lekki.
However, these entries mix:
- Cities
- Local government areas
- Neighbourhoods
- Districts
- Broad metropolitan labels
- Different spellings of the same place
A definitive city ranking would therefore create false precision.
State and FCT figures are currently more reliable for high-level comparisons. Future standardisation of city and local-area fields would make more granular analysis possible.
7. Wedding Demand Is Overwhelmingly Local
Location preference may be even more important than the state ranking.
| Vendor location preference | Requests | Share |
|---|---|---|
| Vendors anywhere within the event state | 988 | 76.9% |
| Vendors only within the event city | 273 | 21.3% |
| Vendors from anywhere in Nigeria | 23 | 1.8% |
A combined 1,261 requests, or 98.2%, preferred vendors located within the event city or state.
Only 23 requesters indicated that vendors could come from anywhere in Nigeria.
Furthermore, only 90 requesters, or 7.0%, said they were willing to pay for vendor travel.
This has several important implications.
Local discoverability matters more than generic visibility
A vendor may have a strong national social media following but still lose opportunities when prospective clients cannot quickly determine:
- The cities served
- The state covered
- Whether travel is available
- Whether travel fees apply
- Whether accommodation is required
- Whether the vendor has previously worked at the proposed venue
- Whether the vendor has a local team
For many vendors, being highly visible to relevant clients in one state may be more commercially valuable than being vaguely visible across Nigeria.
State expansion should be deliberate
Vendors planning to expand into another state should not merely update an Instagram bio to say “available nationwide.”
A credible expansion plan may require:
- Local vendor partnerships
- Travel and accommodation policies
- State-specific portfolio examples
- Reliable logistics
- Backup equipment
- Local assistants
- Clear setup and arrival times
- Knowledge of venues and event practices
- Pricing that remains competitive after travel costs
Smaller states may offer less crowded local opportunities
Lower request volume does not automatically mean poor opportunity.
When clients strongly prefer local vendors, a smaller number of requests can still be commercially meaningful in a location with limited vendor representation.
The most useful question is not simply, “Which state has the most requests?”
It is:
Where does local request activity appear meaningful relative to the number, quality and capacity of vendors available?
8. The Median Stated Guest Count Is 200
Guest counts are one of the most useful indicators of operational scale.
After excluding missing, zero and unusable figures, 1,221 requests contained usable guest counts.
The median was 200 guests.
| Stated guest range | Requests | Share of usable guest counts |
|---|---|---|
| Up to 50 | 72 | 5.9% |
| 51–100 | 190 | 15.6% |
| 101–150 | 175 | 14.3% |
| 151–200 | 222 | 18.2% |
| 201–300 | 301 | 24.7% |
| 301–500 | 213 | 17.4% |
| 501–1,000 | 42 | 3.4% |
| 1,001–2,000 | 6 | 0.5% |
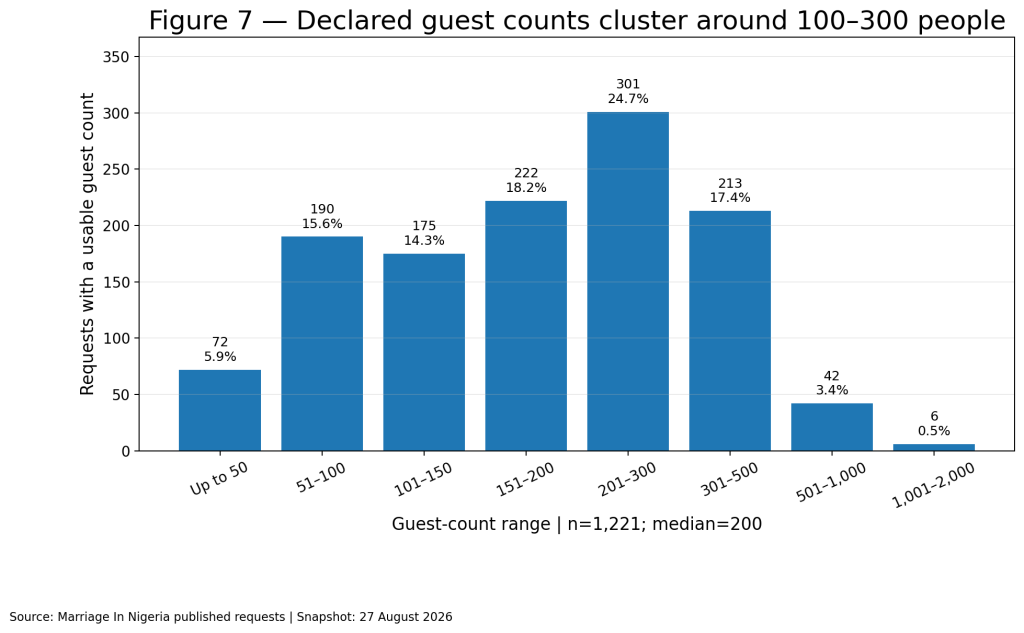
The middle 50% of usable guest figures fell between 150 and 300 guests.
A total of:
- 830 requests, or 68.0%, stated between 100 and 300 guests
- 960 requests, or 78.6%, stated no more than 300 guests
- 48 requests, or 3.9%, stated more than 500 guests
- 23 requests, or 1.9%, stated at least 1,000 guests
This does not support the idea that every Nigerian wedding represented on the platform is a 500-, 1,000- or 2,000-person event.
Large weddings certainly exist, but they are not the typical request.
Guest count varies by event type
Among the major event categories, median stated guest counts were:
- White Wedding: 250 guests
- Traditional Wedding: 200 guests
- White and Traditional Wedding: 250 guests
- Engagement or Introduction: 150 guests
- Walima or Nikah: 225 guests
- Court Wedding: 60 guests
These differences can influence vendor requirements significantly.
A court wedding with 60 guests and a combined white-and-traditional celebration with 250 guests may both be described as weddings, but they require different staffing, logistics, equipment and packages.
Vendors should package around realistic guest bands
Instead of presenting one vague starting price, vendors can make their offers easier to understand by creating packages around recurring guest-count ranges, such as:
- Up to 50 guests
- Up to 100 guests
- 150 guests
- 200 guests
- 300 guests
- 500 guests
- More than 500 guests
This approach is especially valuable for caterers, venues, decorators, rental companies, drinks suppliers, security providers, ushers and planners.
Packages should still explain what changes when guest count increases. More guests may require more than additional food. They can affect:
- Staff numbers
- Tables and chairs
- Linen
- Serving equipment
- Security personnel
- Ushers
- Cooling
- Power
- Toilets
- Parking
- Event duration
- Waste management
- Setup and breakdown time
A useful package helps a client understand the operational consequences of scale.
9. The Median Positive Stated Budget Is ₦2 Million
Budget data requires careful interpretation.
Of the 1,284 requests:
- 931 requests, or 72.5%, stated a positive total budget
- 353 requests, or 27.5%, had no positive total budget recorded
A zero or missing budget should not be interpreted as having no money available. It may mean the requester was flexible, undecided, uncomfortable stating an amount or had not completed that part of the form.
Among the 931 requests with positive stated budgets:
- Median: ₦2,000,000
- Lower quartile: ₦600,000
- Upper quartile: ₦4,000,000
- Average: approximately ₦2.9 million
The median is more representative than the average because a small number of high-budget requests pull the average upward.
| Positive stated budget | Requests | Share |
|---|---|---|
| Under ₦500,000 | 160 | 17.2% |
| ₦500,000–₦999,999 | 127 | 13.6% |
| ₦1 million–₦1.99 million | 147 | 15.8% |
| ₦2 million–₦2.99 million | 129 | 13.9% |
| ₦3 million–₦4.99 million | 166 | 17.8% |
| ₦5 million–₦9.99 million | 150 | 16.1% |
| ₦10 million and above | 52 | 5.6% |
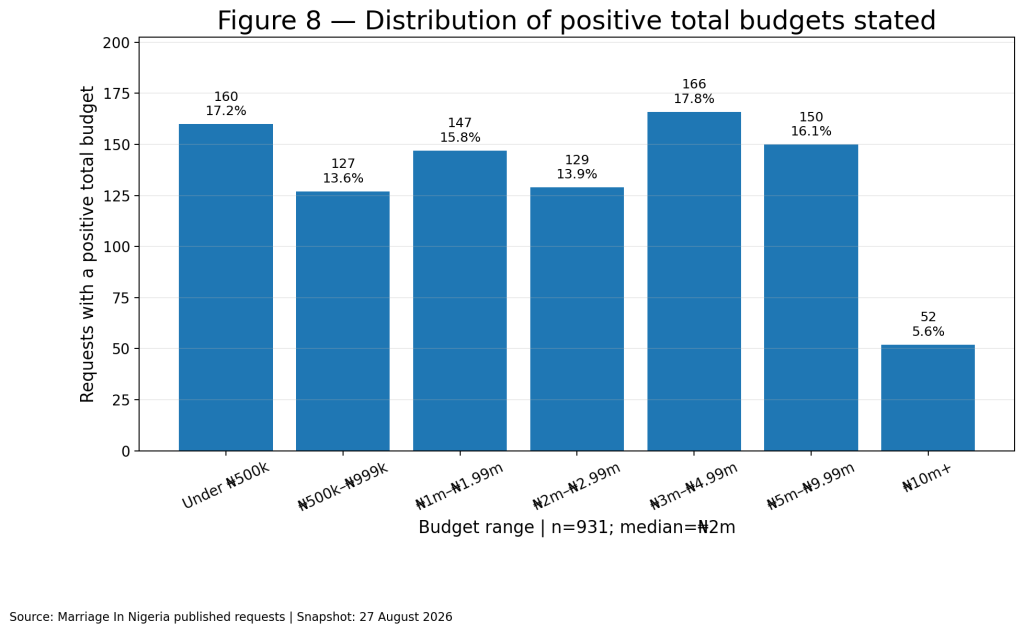
Among positive stated budgets:
- 57.1% were ₦2 million or less
- 87.1% were ₦5 million or less
- 5.6% were ₦10 million or more
The ₦2 million median is not a wedding-cost estimate
The total-budget field exists inside a vendor request.
A requester who selects Venue, Decor and Photography may state the amount available for those services. Another requester may select 18 services and use the same field for a much broader portion of the wedding.
The amounts should therefore be interpreted as stated budgets associated with the published request scope, not verified estimates of everything the wedding will cost.
The data cannot tell us whether the budget includes:
- Rings
- Legal or religious fees
- Family clothing
- Personal attire
- Accommodation
- Travel
- Gifts
- Honeymoon
- Informal family spending
- Payments already made before the request was published
It would be misleading to publish “The average Nigerian wedding costs ₦2 million” based on these requests.
That is not what the figures show.
Request scope explains budget better than event label
The median positive stated budget rises clearly as more services are included.
| Services selected | Requests with positive budgets | Median stated budget |
|---|---|---|
| 1 service | 304 | ₦600,000 |
| 2–3 services | 128 | ₦700,000 |
| 4–6 services | 107 | ₦1,500,000 |
| 7–10 services | 138 | ₦3,000,000 |
| 11–15 services | 154 | ₦4,000,000 |
| 16 or more services | 100 | ₦5,000,000 |
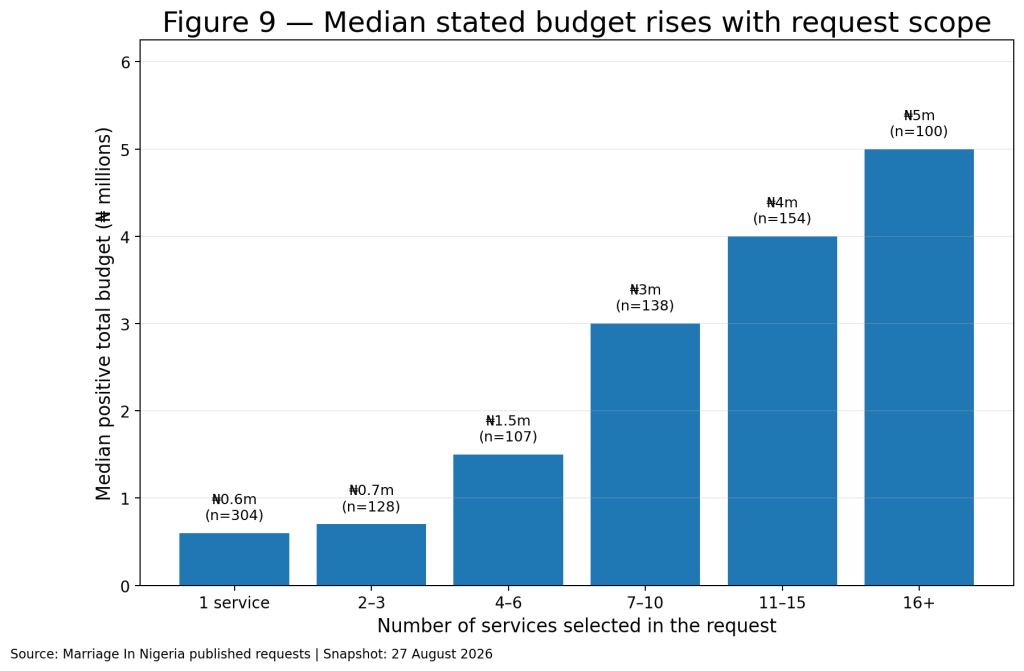
The median positive stated budget for white weddings, traditional weddings and combined white-and-traditional weddings was ₦2 million in each category.
This does not mean those event types cost the same.
It suggests that the number and nature of services included in the request may explain the stated amount more clearly than the ceremony label alone.
What couples can learn from this
When publishing a request, it helps to distinguish between:
- The total amount available for the entire celebration
- The portion allocated to the services being requested
- The amount already committed elsewhere
- The services where some flexibility remains
A clearer budget can reduce irrelevant responses and help suitable vendors propose realistic options.
What vendors can learn from this
A ₦2 million request should never be treated as ₦2 million available to one vendor.
Before quoting, a vendor should examine:
- The number of selected services
- Guest count
- Event type
- Location
- Venue status
- Event date
- Travel expectations
- The details written by the requester
- Whether the amount is total or service-specific
A strong response helps the requester understand what can realistically be delivered within the relevant portion of the budget.
10. Most Requests Are Published Months Before the Event
Among requests with usable publication and event dates, the median planning lead time was 127 days.
That is a little more than four months.
| Time between publication and event | Requests | Share |
|---|---|---|
| 0–30 days | 64 | 5.3% |
| 31–60 days | 141 | 11.7% |
| 61–90 days | 175 | 14.6% |
| 91–180 days | 478 | 39.8% |
| 181–365 days | 304 | 25.3% |
| More than one year | 40 | 3.3% |
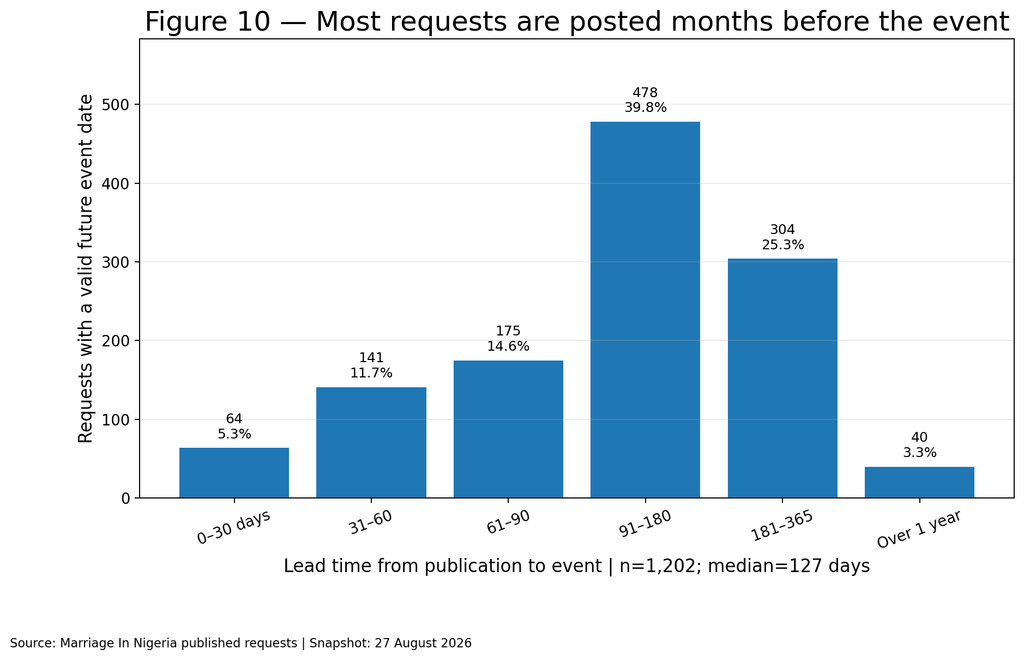
A total of:
- 94.7% were published more than 30 days before the event
- 82.9% were published more than 60 days before the event
- 68.4% were published more than 90 days before the event
- 28.6% were published more than 180 days before the event
Only 5.3% fell within the final 30 days.
The dominant request window is therefore not last-minute planning. It is the period between approximately three and six months before the event.
Date flexibility remains common
A total of 680 requesters, or 53.0%, indicated that their date was flexible.
Some still provided a proposed date while indicating flexibility. This may mean they were open to nearby dates depending on:
- Venue availability
- Vendor availability
- Family considerations
- Religious calendars
- Travel arrangements
- Pricing
- Work schedules
- Public holidays
There were also 81 requests without an exact event date.
Vendors need a longer follow-up mindset
A requester planning four, six or nine months ahead may not choose a vendor immediately.
The first response may form part of an extended decision process involving:
- Comparing quotations
- Discussing costs with a partner
- Consulting family members
- Visiting venues
- Adjusting guest count
- Waiting for funds
- Confirming a church, mosque or registry date
- Coordinating several vendors
A thoughtful follow-up process can therefore be more effective than sending one message and assuming a lack of immediate payment means the opportunity is lost.
Follow-up should remain respectful and relevant. Useful follow-ups might include:
- Confirming continued availability
- Answering an unanswered question
- Sharing a suitable portfolio example
- Clarifying a package
- Notifying the client when a date is becoming limited
- Offering a call or consultation
- Explaining the next booking step
Repeated generic messages are unlikely to build trust.
11. Saturday Remains the Dominant Event Day
Among 1,203 requests with a usable event date, Saturday accounted for 856.
| Day of the week | Requests | Share |
|---|---|---|
| Saturday | 856 | 71.2% |
| Thursday | 91 | 7.6% |
| Friday | 82 | 6.8% |
| Sunday | 70 | 5.8% |
| Tuesday | 40 | 3.3% |
| Wednesday | 37 | 3.1% |
| Monday | 27 | 2.2% |
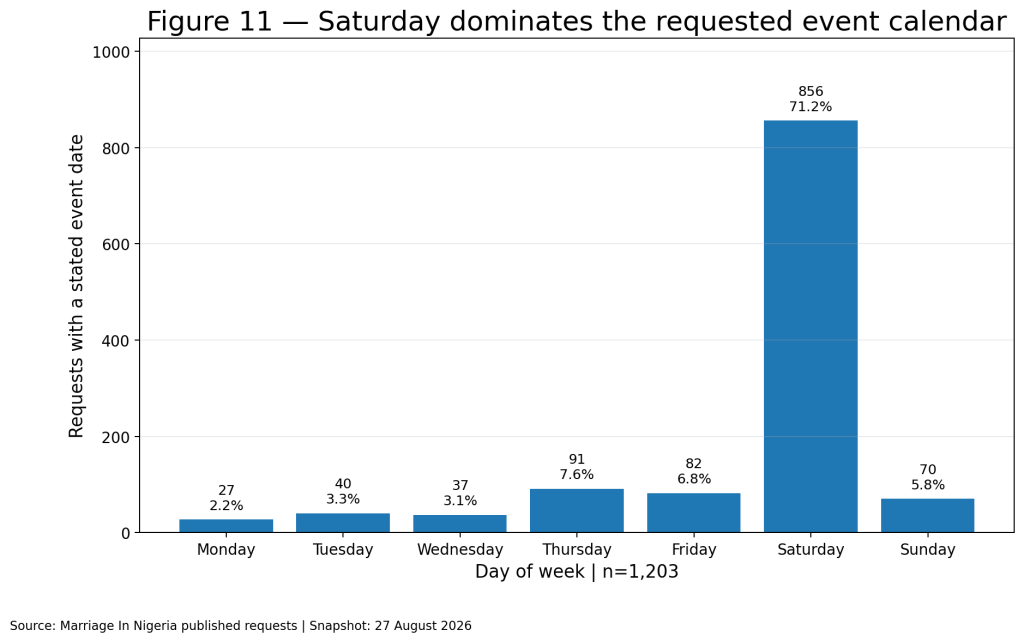
Saturday is clearly the primary event day, but nearly three in ten dated requests fall on another day.
Thursday and Friday together account for 14.4%, while Sunday accounts for another 5.8%.
Different event types can contribute to weekday activity, including:
- Court weddings
- Introductions
- Traditional ceremonies
- Walima or Nikah ceremonies
- Receptions
- After-parties
- Pre-wedding events
- Events scheduled around religious or family considerations
Saturday demand creates a capacity problem
Many vendors can serve only one major wedding on a Saturday.
This means a vendor may receive significant demand but still have limited inventory because the inventory is effectively the vendor’s time, team or equipment on a specific date.
Vendors can respond by developing:
- Trained secondary teams
- Clear associate-vendor arrangements
- Reliable referral networks
- Transparent availability calendars
- Peak-date pricing
- Weekday packages
- Backup staff and equipment
- Earlier deposit deadlines for high-demand dates
Couples planning a Saturday event should recognise that popular vendors may become unavailable long before the wedding month.
Current event-month concentrations should be treated cautiously
A large portion of currently scheduled events falls within the months immediately ahead of the data snapshot, including October, November and December 2026.
This does not yet prove permanent seasonality. The data naturally contains more upcoming events within the visible planning horizon.
Several years of observations will be needed before confidently describing annual seasonal patterns.
12. Requesters Prefer Local Vendors and Message-Based Contact
Planning preferences reveal how requesters want the marketplace to work.
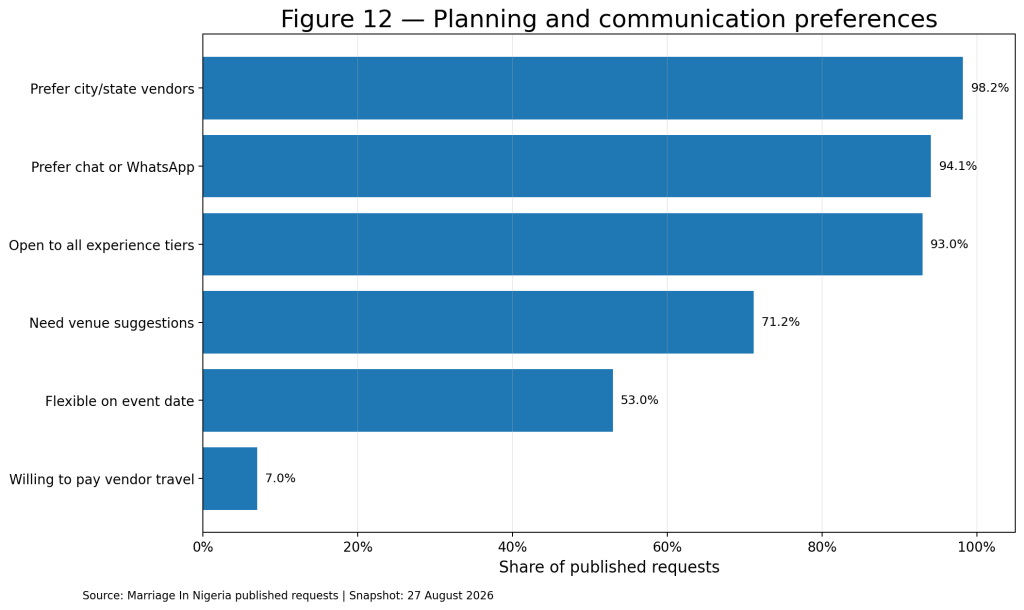
The strongest preference signals are:
| Preference | Share of requests |
|---|---|
| Vendor within the event city or state | 98.2% |
| Chat or WhatsApp contact | 94.1% |
| Open to all listed experience tiers | 93.0% |
| Needs venue suggestions | 71.2% |
| Flexible event date | 53.0% |
Messaging is overwhelmingly preferred
Preferred contact methods were:
| Contact method | Requests | Share |
|---|---|---|
| Chat | 856 | 66.7% |
| 352 | 27.4% | |
| 50 | 3.9% | |
| Call | 18 | 1.4% |
| Phone Call | 8 | 0.6% |
Chat and WhatsApp collectively account for 94.1% of preferred contact choices.
The labels “Call” and “Phone Call” appear separately because contact options have evolved. Together, direct phone contact still represents only a small proportion of stated preferences.
The practical lesson is not that vendors should abandon professional quotations or email.
It is that the first point of contact should work well on a mobile phone.
A strong first message should make it easy to understand:
- Who the vendor is
- Which request is being answered
- Whether the date is available
- Whether the location is covered
- The relevant service
- A sensible price or price range
- What is included
- A portfolio link
- The next step
A long, unstructured message that forces the client to search for basic information can lose attention.
After initial engagement, a formal quotation, contract or invoice may still be appropriate.
Evening is the most frequently preferred contact period
Best-time-to-contact selections were:
- Evening: 489 requests, or 38.1%
- Afternoon: 445 requests, or 34.7%
- Morning: 350 requests, or 27.3%
The distribution is relatively balanced, but evening leads.
This may reflect people planning weddings outside working hours. It does not give vendors permission to contact requesters at inappropriate times. It does suggest that delayed responses until the following working day may not always match the requester’s preferred engagement window.
Most requesters are open to all experience levels
A total of 1,194 requests, or 93.0%, selected the option covering all experience tiers.
Only:
- 76 requests selected Experienced vendors
- 14 selected Top-Rated vendors
This field may partly reflect the form’s default or broadest option, so it should not be interpreted as proof that experience is unimportant.
It does suggest that requesters are often willing to consider a wider range of vendors when the offer, location, portfolio and price are suitable.
Newer vendors may therefore have an opportunity to compete through relevance, presentation, responsiveness and professionalism.
Social platforms dominate self-reported discovery
When requesters identified how they discovered the platform:
- Instagram accounted for 746 requests, or 58.1%
- Facebook accounted for 496 requests, or 38.6%
Together, Instagram and Facebook represented 96.7% of self-reported sources.
This should not be interpreted as proof that nearly every Nigerian couple discovers wedding vendors through those two platforms.
It describes the current acquisition footprint of the Marriage In Nigeria request flow.
Nevertheless, it reinforces the importance of social media in bringing wedding-planning demand into a more structured marketplace.
Social media may create awareness, while a platform profile, published request, quotation process and performance history can provide the structure needed to move from discovery to a transaction.
13. Most Published Requests Remain Active at the Current Snapshot
At the time of analysis:
| Request status | Requests | Share |
|---|---|---|
| Active | 1,005 | 78.3% |
| Closed by the requester | 279 | 21.7% |
An active request is still available within the platform’s current request lifecycle.
A closed request is no longer accepting vendor contact.
It is important not to interpret the 279 closed requests as 279 confirmed bookings. A requester may close a request because:
- A vendor was selected
- Plans changed
- The event was postponed
- The event was cancelled
- Enough responses were received
- The requester no longer wanted to be contacted
- Services were sourced elsewhere
Reliable booking conversion requires explicit outcome tracking.
Marriage In Nigeria also publishes client request reviews, which can provide qualitative context alongside the numerical data. Reviews, however, should still be treated separately from a complete conversion measurement.
Future editions of this report would become even more valuable with aggregated measures such as:
- Number of vendor responses per request
- Time to first response
- Number of shortlisted vendors
- Number of quotations received
- Confirmed booking outcomes
- Final amount agreed
- Reasons for closing without booking
- Requester satisfaction
- Vendor response quality
These measures would make it possible to study not only demand but also how effectively that demand is served.
14. Some Services Have Far More Request Activity Relative to Directory Representation
The companion report, Wedding Vendor Landscape: Live Data From Marriage In Nigeria, analyses active vendor profiles across the directory.
Comparing service selections in published requests with active profiles produces a directional platform-coverage indicator.
| Service | Request selections | Active profiles in companion report | Selections per active profile |
|---|---|---|---|
| Car Hire | 294 | 16 | 18.4 |
| Security | 307 | 22 | 14.0 |
| Ushers | 362 | 52 | 7.0 |
| Lighting | 421 | 69 | 6.1 |
| Drinks and Bar | 189 | 31 | 6.1 |
| MC | 484 | 83 | 5.8 |
| Venue | 864 | 163 | 5.3 |
| Alaga or Alaga Ijoko | 157 | 30 | 5.2 |
| Band | 239 | 53 | 4.5 |
| Hair | 297 | 71 | 4.2 |
| Rentals | 386 | 157 | 2.5 |
| Makeup | 349 | 147 | 2.4 |
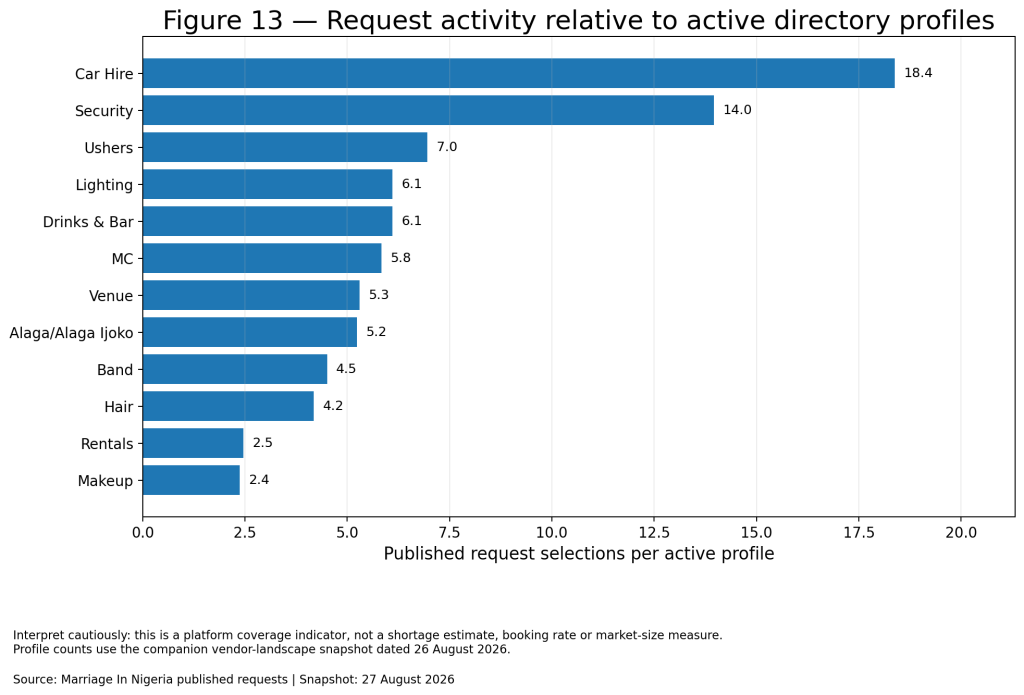
Car Hire and Security have the highest number of request selections relative to active directory profiles.
Venue, Ushers, Lighting, Drinks and Bar, MC, Alaga or Alaga Ijoko, Band and Hair also appear comparatively stretched.
What this comparison does not mean
It does not prove that these categories have nationwide vendor shortages.
It also does not mean that a car-hire profile will automatically receive 18 bookings.
The comparison has several limitations:
- One vendor can serve several requests.
- Some vendors have larger teams or fleets than others.
- One request can receive responses from several vendors.
- Profile counts do not measure availability on a particular date.
- Request and profile snapshots cover related but not identical periods.
- Service quality and geographic distribution are not represented in one ratio.
- Some active businesses may not yet be listed.
- Some listed profiles may have different operational capacity.
The ratio should therefore be treated as a directory coverage indicator, not a booking rate, conversion rate, shortage estimate or market-size measure.
What the comparison may indicate
The figures can still help identify where deeper profile coverage may be valuable.
For Marriage In Nigeria, this may support targeted onboarding of:
- Car-hire companies
- Event-security businesses
- Ushering companies
- Lighting providers
- Drinks and bar services
- MCs
- Venues
- Alagas
- Live bands
- Hairstylists
The most useful onboarding strategy would not focus only on the national category total. It would compare each category with request activity within individual states and cities.
For vendors, comparatively high request activity may signal an opportunity to strengthen local visibility. It does not remove the need for professionalism, responsiveness, suitable pricing and proof of work.
15. What These Wedding Demand Trends Mean for Couples
The data suggests several practical ways couples and event planners can improve their vendor search.
Start serious vendor sourcing three to six months ahead
The median request is published 127 days before the event, while nearly seven in ten usable requests are published more than 90 days ahead.
Starting within this period gives couples more time to:
- Compare vendors
- Visit venues
- Review contracts
- Confirm availability
- Adjust the budget
- Coordinate related services
- Avoid making decisions under unnecessary pressure
Highly sought-after Saturday dates may require an even earlier start.
The Ultimate Guide to Planning a Nigerian Wedding provides broader planning guidance that can be used alongside the demand findings in this report.
Resolve the venue question early
Venue affects nearly every operational decision.
Before contacting several vendors, establish:
- Preferred state and city
- Indoor or outdoor preference
- Estimated guest count
- Ceremony and reception arrangement
- Parking requirements
- Accessibility
- Power supply
- Sound restrictions
- Setup access
- Closing time
- Included furniture or equipment
- Alternative options if the preferred venue is unavailable
Couples who do not yet have a venue should state that clearly when they post a wedding vendor request.
Separate the overall wedding budget from the request budget
A clearer budget produces better responses.
Rather than entering one amount without context, explain:
- Which services the amount covers
- Whether the venue has already been paid for
- Whether the amount is fixed or flexible
- Which services are priorities
- Where compromises are possible
- Whether travel is included
- Whether the quotation should include taxes, transport or accommodation
Be precise about guest count
A difference between 150 and 300 guests can substantially change costs and logistics.
Even when the final list is not ready, provide:
- Current estimate
- Expected minimum
- Expected maximum
- Date by which the final count will be confirmed
Use date flexibility strategically
More than half of requesters indicate some date flexibility.
A flexible date can improve access to:
- Preferred venues
- Popular vendors
- Better weekday pricing
- Alternative setup periods
- More convenient travel arrangements
Flexibility is most valuable when it is clearly defined. “Flexible within the same weekend” is different from “flexible within the same month.”
Evaluate coordinated service combinations
Because services often travel together, couples should check how different vendors will work as a team.
Useful questions include:
- Has the photographer worked with the videographer before?
- Who coordinates the DJ, MC and live band?
- Does the decorator provide or subcontract lighting?
- What furniture is already included by the venue?
- Who manages security and ushering responsibilities?
- Does the planner coordinate vendor arrival and setup?
- Who is accountable when a subcontracted service fails?
Coordination should be agreed before the event, not improvised on the day.
16. What These Trends Mean for Wedding Vendors
The data also provides clear commercial lessons for vendors.
Build local visibility first
With 98.2% of requesters preferring vendors within their city or state, every vendor profile should clearly state:
- Primary city
- State
- Areas served
- Travel availability
- Travel fees
- Accommodation requirements
- Response time
- Whether a local team is available
Location should also appear naturally in profile descriptions, portfolio captions and service pages.
Vendors seeking more visibility can review the requirements to become a wedding vendor on Marriage In Nigeria.
Create packages that reflect real request sizes
The median guest count is 200, while most usable requests fall between 100 and 300 guests.
Packages designed around recurring guest bands will usually be easier to understand than a generic “contact us for price” offer.
Each package should explain:
- Capacity
- Deliverables
- Staffing
- Service duration
- Setup and breakdown
- Transport
- Overtime
- Exclusions
- Upgrade options
- Deposit
- Cancellation terms
Build complementary partnerships
The strongest service pairs reveal obvious partnership opportunities:
- Photographer and Videographer
- DJ and MC
- Hair and Makeup
- Decor and Lighting
- Venue and Rentals
- Security and Ushers
- Planner and Decor
- Caterer and Drinks or Bar
A partnership should not merely involve exchanging phone numbers. Strong partnerships require:
- Defined responsibilities
- Reliable response times
- Consistent quality expectations
- Transparent referral arrangements
- Compatible pricing
- A process for handling client complaints
- Backup plans
- Respect for the client relationship
Respond for mobile reading
Since Chat and WhatsApp dominate contact preferences, the first response should be concise enough to read on a phone but detailed enough to be useful.
A practical response sequence is:
- Greet the requester by name.
- Mention the specific event and service.
- Confirm whether the date and location are covered.
- State the most relevant package or starting range.
- Explain the main inclusions.
- Share one portfolio link.
- Ask one or two necessary questions.
- Provide a clear next step.
A generic “Hello, we are available” message does little to help a client make a decision.
Follow up according to the planning timeline
With a median lead time of 127 days, many opportunities require nurturing.
Vendors can organise follow-up stages around:
- Initial response
- Quotation sent
- Questions answered
- Consultation completed
- Date temporarily held
- Deposit deadline
- Final confirmation
A simple customer-management process can prevent serious enquiries from becoming lost inside WhatsApp conversations.
Prepare for Saturday capacity constraints
Saturday represents 71.2% of dated requests.
Vendors with limited Saturday capacity should maintain an accurate calendar and avoid accepting more work than they can deliver properly.
Growth may require:
- Training another team
- Documented operating procedures
- Standard equipment lists
- Backup suppliers
- Quality-control checks
- Clear associate-vendor disclosure
- Reliable supervision
Expansion should not reduce the quality promised to the client.
Do not rely only on low prices
Most requesters are open to a broad range of experience tiers, but that does not mean price is the only deciding factor.
A less-established vendor can become competitive by demonstrating:
- Clear communication
- Relevant local experience
- A focused portfolio
- Professional quotations
- Reliable availability
- Transparent terms
- Suitable packages
- Strong client feedback
- Fast and thoughtful responses
Trust is often built through the quality of the buying experience before the service is delivered.
17. What Marriage In Nigeria and the Wider Industry Can Learn
The data points toward several product and industry opportunities.
Venue discovery deserves deeper support
Venue leads both service selection and venue-suggestion requests.
Useful venue-discovery improvements could include structured filters for:
- State and city
- Guest capacity
- Indoor or outdoor use
- Parking
- Accommodation
- Power supply
- Air conditioning
- Accessibility
- Catering restrictions
- Alcohol policy
- Sound and closing-time restrictions
- Included furniture
- Changing rooms
- Price range
Venue availability is also time-sensitive. A future availability or enquiry-management layer could reduce repeated contact with unsuitable venues.
Multi-service requests need structured responses
A requester selecting 15 services may receive a confusing collection of unrelated messages.
Structured quotation responses could help the requester compare:
- Vendor
- Service
- Price
- Availability
- Inclusions
- Exclusions
- Travel cost
- Deposit
- Response time
- Rating or review
- Portfolio
This would preserve vendor independence while making multi-service planning easier.
City and local-area data should become more standardised
The large number of free-text city entries limits city-level analysis.
Structured geographic fields could support:
- State
- City
- Local government area
- Neighbourhood
- Landmark
- Travel radius
This would improve matching, local advertising and future research.
Outcome tracking would complete the demand picture
Published requests reveal what people seek. They do not yet reveal the full journey from request to successful event.
Future reporting would benefit from tracking:
- Vendor responses
- Shortlists
- Quotes
- Bookings
- Deposits
- Final transaction values
- Service completion
- Reviews
- Disputes
- Repeat usage
This would allow the platform to distinguish between high enquiry volume and demand that successfully converts into business.
Category acquisition should reflect request activity
The comparison with active vendor profiles suggests that some specialist categories may benefit from deeper directory representation.
Onboarding can become more precise by combining:
- Service category
- State
- City
- Request volume
- Existing profile count
- Active-vendor capacity
- Response rate
- Client review quality
This is more useful than trying to grow every vendor category equally.
18. Important Limitations
A useful data report should explain what its numbers cannot prove.
This is platform data
The findings describe requests published on Marriage In Nigeria. They should not be generalised automatically to every wedding in the country.
Requests are not unique weddings
One person may publish more than one request, revise a request or create separate requests for connected events. The report counts published requests, not verified unique couples or ceremonies.
Service percentages overlap
A request can select several categories. The service percentages cannot be summed to calculate a total market share.
Budgets are self-reported
The figures are not verified bank balances, invoices, final expenditure or completed transaction amounts.
Missing budget does not mean zero budget
Requests without a positive amount may reflect flexibility, uncertainty, privacy concerns or incomplete information.
Total budget may cover different scopes
One person may enter an amount for one service, while another uses the same field for 16 services. Direct comparison must account for request scope.
Per-service budget fields were not used as benchmarks
Per-service entries were comparatively incomplete and were not consistently expressed. Some appeared to be totals, ranges or per-person amounts.
Using them as precise category-price benchmarks would create false accuracy.
Guest counts are estimates
The final number attending an event may differ from the figure entered when the request was published.
Location is self-reported
State-level analysis is more reliable than city-level analysis because city entries use free text and can mix cities, local government areas, districts and neighbourhoods.
Publication growth is not national market growth
Monthly increases may reflect greater platform awareness and acquisition activity rather than a proportional increase in weddings across Nigeria.
Current event dates contain planning-horizon bias
Events closer to the snapshot date are more likely to appear in the data. A longer history is required for strong conclusions about seasonal demand.
Closed requests are not confirmed bookings
A request can be closed for several reasons. Booking conversion should be measured separately.
Profile ratios are directional
Comparisons between request selections and vendor profiles do not account for vendor capacity, availability, quality, location or number of responses received.
These limitations do not make the report less valuable. They define the boundaries within which the findings should be used responsibly.
19. Key Findings
The current edition of the Marriage In Nigeria wedding demand report reveals that:
- Venue is the strongest demand category. It appears in 67.3% of requests, while 71.2% of requesters ask for venue suggestions.
- Most people need several vendors. Seventy per cent of requests include more than one service, and 26.3% include at least 11 services.
- Venue dominates targeted enquiries. It accounts for 60.3% of all single-service requests.
- Certain services behave as natural bundles. Photography and videography, DJ and MC, Hair and Makeup, Decor and Lighting, Venue and Rentals, and Security and Ushers frequently appear together.
- Demand is geographically concentrated but not limited to one region. Lagos leads with 44.9%, while 30 state or FCT entries are represented.
- Local presence is extremely important. A combined 98.2% prefer vendors within the event city or state.
- The typical request is not for a 1,000-person wedding. The median usable guest count is 200, and 78.6% state 300 guests or fewer.
- The median positive stated request budget is ₦2 million. However, this should not be interpreted as the complete cost of a Nigerian wedding.
- Scope strongly influences budget. Median positive budgets rise from ₦600,000 for one-service requests to ₦5 million for requests involving 16 or more services.
- Most demand is visible months ahead. The median planning lead time is 127 days, and 68.4% of usable requests are published more than 90 days before the event.
- Saturday dominates the calendar. It accounts for 71.2% of dated requests.
- Messaging is the preferred starting point. Chat and WhatsApp collectively account for 94.1% of preferred contact methods.
- Some specialist categories have comparatively thin directory representation. Car Hire, Security, Ushers, Lighting, Drinks and Bar, MC, Venue and other categories show high request activity relative to active profile counts.
Frequently Asked Questions
What are wedding demand trends?
Wedding demand trends are recurring patterns in what people planning weddings request. They can include services needed, event types, locations, budgets, guest counts, planning timelines, preferred contact methods and vendor-location preferences.
How many requests are included in this report?
The current edition analyses 1,284 requests published on Marriage In Nigeria between 10 September 2025 and 27 August 2026.
What is the most requested wedding service?
Venue is the most frequently selected service. It appears in 864 requests, representing 67.3% of all requests analysed.
What is the typical wedding guest count?
The median usable stated guest count is 200. Approximately 68.0% of usable requests fall between 100 and 300 guests.
What is the average wedding budget in Nigeria?
This report does not calculate the average cost of a Nigerian wedding.
Among requests that stated a positive total budget, the median was ₦2 million. However, the amount may cover only the services included in the request rather than the entire wedding.
How early do people begin looking for wedding vendors?
The median interval between request publication and the proposed event date is 127 days. Approximately 68.4% of usable requests are published more than 90 days before the event.
What day are most weddings scheduled for?
Saturday accounts for 71.2% of the requests with usable event dates.
Do most requesters want vendors from anywhere in Nigeria?
No. A combined 98.2% prefer vendors within the event city or state. Only 1.8% indicate that vendors can come from anywhere in Nigeria.
Does a closed request mean the requester booked a vendor?
Not necessarily. A request can be closed after a booking, but it can also be closed because plans changed, enough responses were received, the event was postponed or the requester no longer wished to be contacted.
Where can couples find wedding vendors?
Couples and event planners can search the Marriage In Nigeria wedding vendor directory.
How can someone publish a request?
A couple or event planner can post a wedding vendor request and provide the services needed, event type, location, date, guest count, budget and other planning details.
How can wedding businesses join the directory?
Wedding businesses can review the process to become a wedding vendor on Marriage In Nigeria.
How to Cite This Report
Suggested citation:
Marriage In Nigeria. “Wedding Demand Trends: Live Data From Marriage In Nigeria.” Data snapshot dated 27 August 2026. https://marriageinnigeria.ng/wedding-demand-trends-live-data/
When quoting a statistic, include the date of the data snapshot because this is a living report and the figures will be updated over time.
Update History
| Date | Published requests analysed | Update |
|---|---|---|
| 27 August 2026 | 1,284 | First edition of the living wedding demand report |
Final Perspective
The most valuable conclusion is not simply that Nigerian weddings require many vendors or that Lagos currently leads the request count.
The data provides a more specific and actionable picture.
On Marriage In Nigeria, wedding demand is:
- Venue-led, with most requesters still needing help identifying a suitable location
- Multi-service, with seven in ten requests involving more than one vendor category
- Locally constrained, with almost every requester preferring vendors within the city or state
- Centred around moderate-to-large events, with a median of 200 guests
- Sensitive to request scope, with budgets rising as more services are included
- Planned months ahead, rather than predominantly at the last minute
- Concentrated on Saturdays, creating genuine date-capacity pressure
- Communicated through messaging, especially Chat and WhatsApp
- Built around connected services, creating strong opportunities for professional vendor collaboration
For couples, these findings can support earlier and more structured planning.
For vendors, they show the value of local visibility, coordinated partnerships, clear packages, fast communication and disciplined follow-up.
For Marriage In Nigeria, the data provides a foundation for building a more transparent and efficient wedding marketplace—one in which requesters can understand their options and capable vendors can find relevant opportunities.
You can explore the latest published wedding vendor requests, browse the wedding vendor directory, read more wedding planning resources or compare these demand findings with the companion report, Wedding Vendor Landscape: Live Data From Marriage In Nigeria.