




Last updated: 2 September 2026
What happens when thousands of wedding businesses meet more than a thousand detailed requests for help?
The answer goes far beyond a list of popular services. Our latest wedding vendor supply and demand analysis reveals a marketplace where requesters often need several providers at once, vendor profiles usually list one service, and location can matter as much as category. It also shows why a large directory does not automatically create a perfect match for every date, brief or budget.
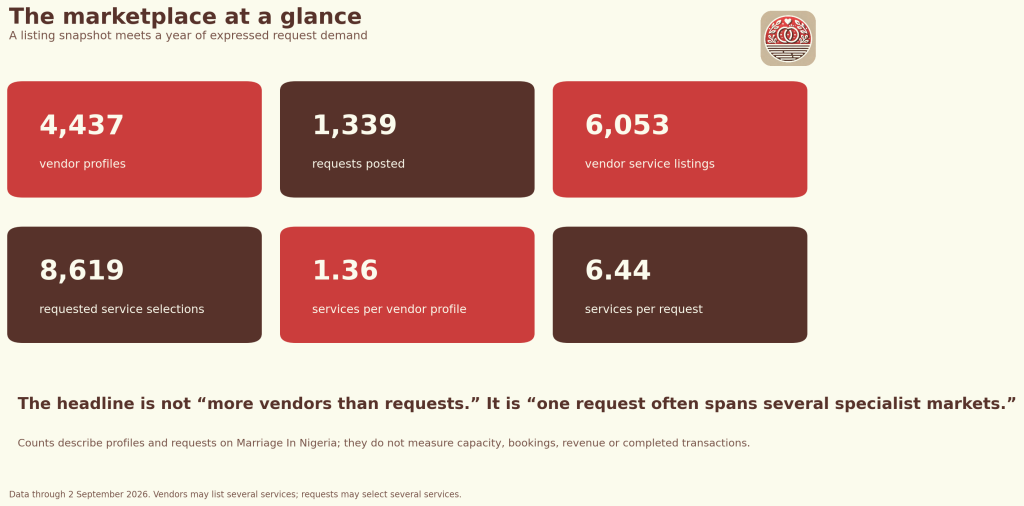
This edition compares 4,437 vendor profiles with 1,339 wedding vendor requests on the Marriage In Nigeria wedding marketplace. The request records cover 10 September 2025 to 2 September 2026, while the vendor figures describe profiles present at the 2 September 2026 update. New profiles and requests continue to arrive, so we will refresh this report from time to time.
Readers who want each side on its own can explore our Wedding Vendor Landscape report and Wedding Demand Trends report. This article adds the missing comparison: how closely does listed supply resemble the mix of needs that requesters express?
The findings at a glance
- This edition analyses 4,437 vendor profiles and 1,339 cumulative requests.
- Vendors listed 6,053 service assignments, or 1.36 services per profile on average. Requesters selected 8,619 services, or 6.44 per request.
- Venue appeared in 890 requests (66.5%), making it the most requested category. Photography led listed supply with 1,271 profiles (28.6%).
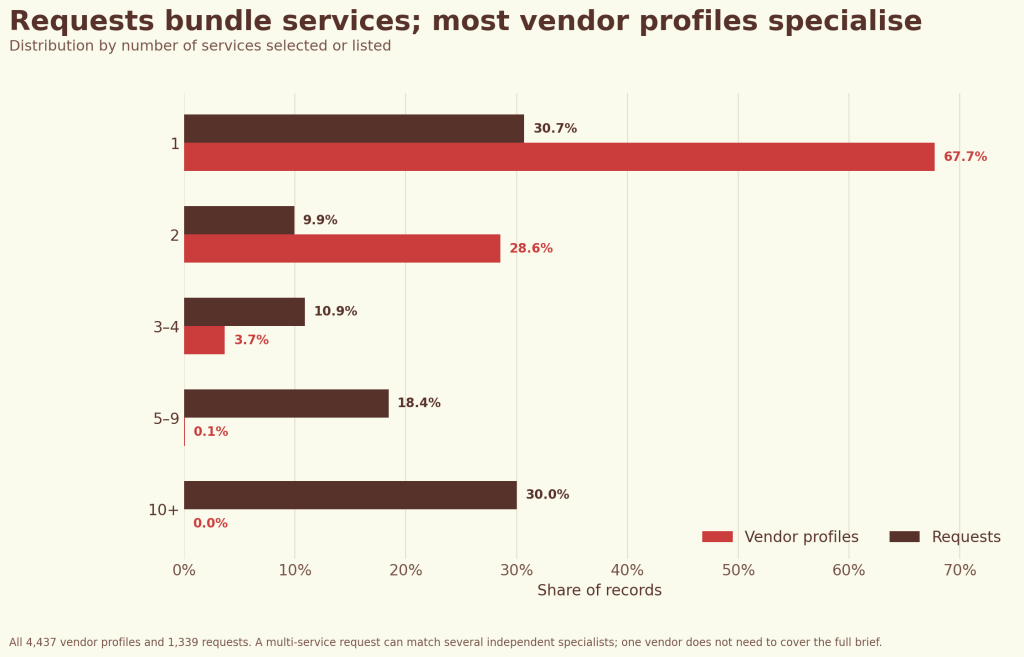
- 69.3% of requests included more than one service, compared with 32.3% of vendor profiles that listed more than one service.
- Car Hire, Security, Ushers, Drinks & Bar, Lighting, MC, Alaga/Alaga Ijoko and Venue occupied much larger shares of the request mix than of the vendor-service mix.
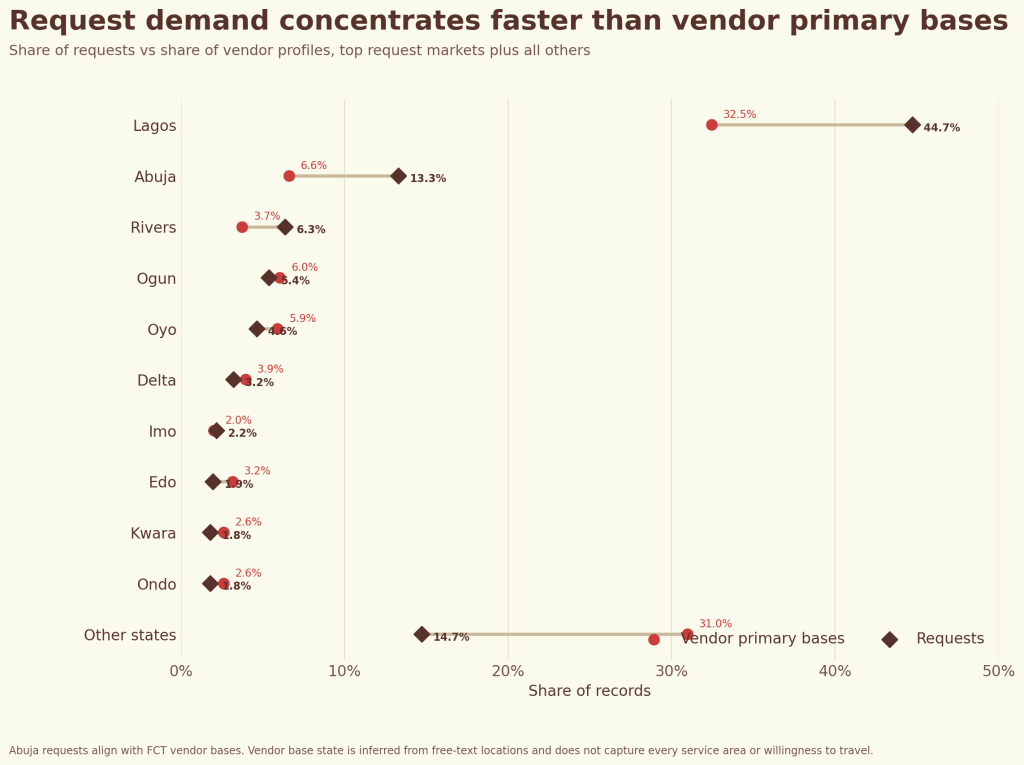
- Lagos, Abuja and Rivers accounted for 64.4% of requests but 42.8% of vendor primary bases.
- 27.3% of requests used a flexible budget. Among the positive fixed budgets, the median reached ₦2 million.
- The median dated request sat 125 days ahead of its event when posted, while 71.1% of usable event dates fell on a Saturday.
First, understand what the marketplace measures
Marriage In Nigeria operates as a discovery and connection marketplace. Couples and event planners can browse wedding vendors, contact a listed business from its profile or post a wedding vendor request. Registered vendors can review public request details and decide whether a brief suits their service, location and availability.
When a vendor wants to initiate contact from a request, the vendor generally pays for a single unlock or timed access package; an eligible Gold access period can also qualify. That access reveals the requester’s protected WhatsApp or email details under the privacy and request-contact policy. The vendor then contacts the requester directly, and other eligible vendors may access the same request.
Marriage In Nigeria does not enter the resulting agreement. Vendors and clients negotiate scope, price, payment, delivery and service performance between themselves. The platform does not guarantee a reply, booking, job or payment, and request access does not create exclusivity. Readers can review how request access and direct contact work, check the current vendor pricing and access options, and read the platform Terms of Service for the full position.
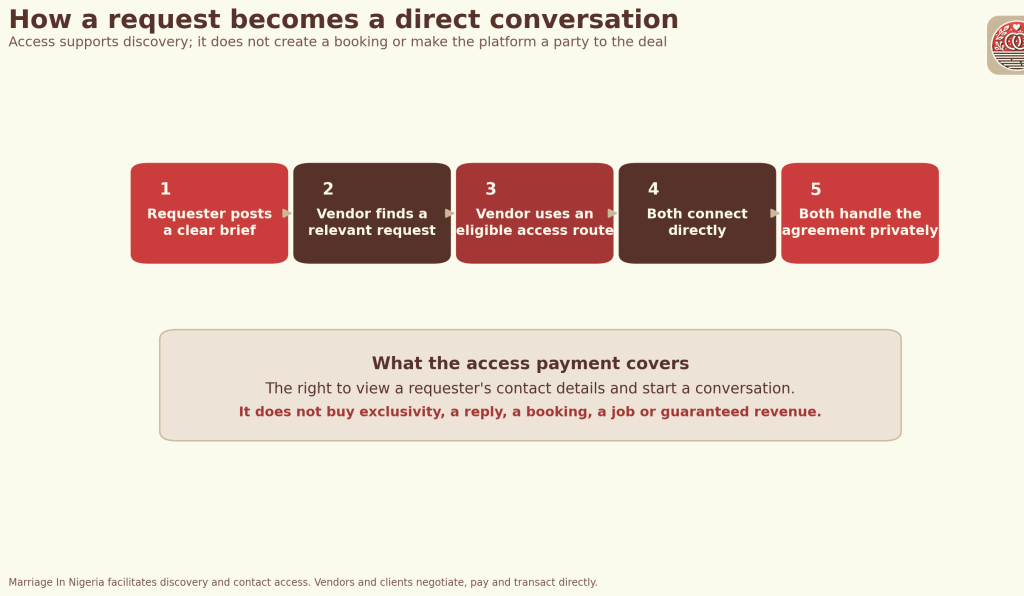
That distinction shapes every conclusion below. A request expresses a need; it does not prove a completed booking. Likewise, a vendor profile shows listed presence; it does not prove availability for a certain Saturday, city, budget or event.
One headline ratio cannot describe a multi-service market
At first glance, 4,437 vendor profiles against 1,339 requests works out to roughly 3.3 profiles per request. That ratio sounds comfortable, but it combines businesses that offer different services in different places and at different times. It also ignores how many categories each requester needs.
The service selections tell a more useful story. Most vendors describe a focused offer: 3,004 profiles, or 67.7%, list one service. Another 1,267 profiles list two, and only 166 list three or more. Across the whole directory, vendors average 1.36 listed services and record a median of one.
Requests look very different. The average request includes 6.44 services, while the median includes four. In total, 928 requests seek multiple services, and 347 requests—25.9% of the whole set—cover 11 or more categories.
This pattern does not mean that every vendor should become a one-stop wedding company. Instead, it shows how the marketplace brings multiple specialists around one event. A couple can describe the broader job once, then evaluate the photographers, venues, caterers, entertainers and support teams that fit each part.
Venue leads requests; photography leads vendor listings
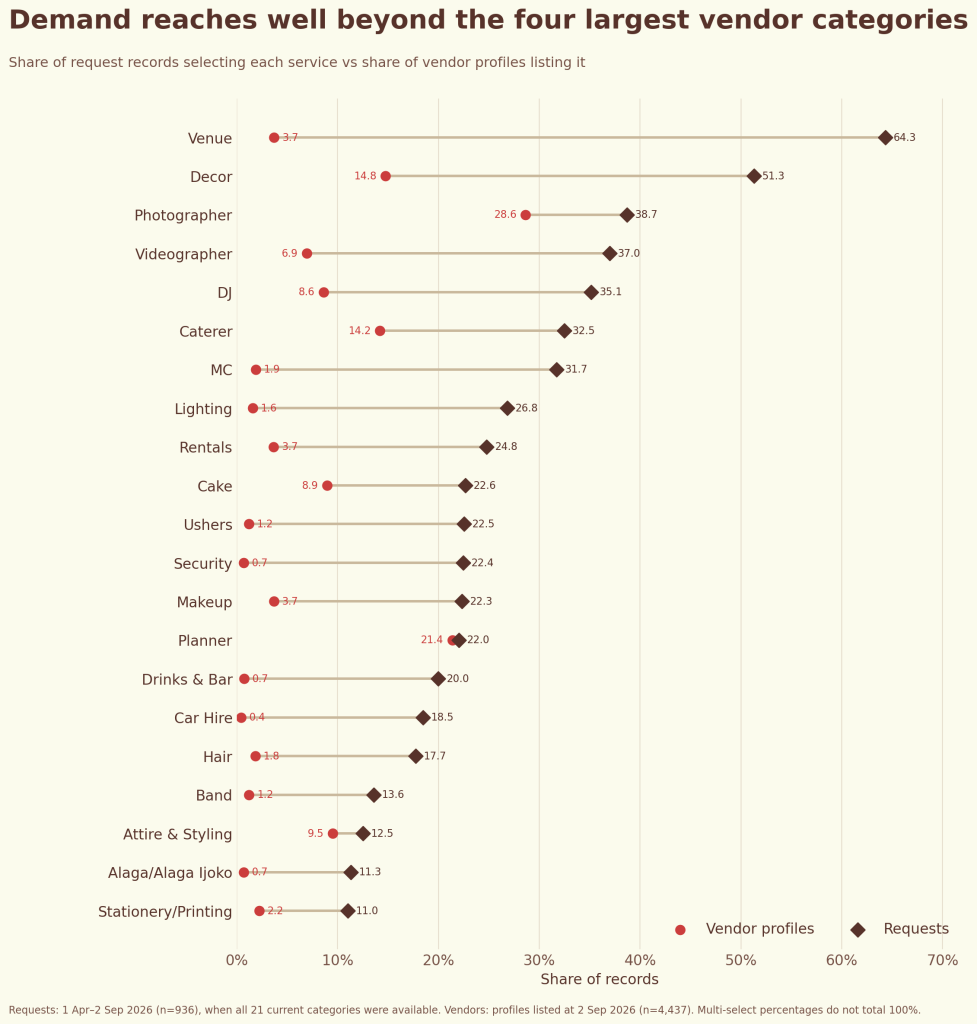
Requesters selected Venue more often than any other service. It appears in 890 requests, or 66.5% of all records. Decor follows at 57.4%, then Photographer at 44.8%, Videographer at 42.1% and DJ at 40.5%.
Vendor listings start from another centre of gravity. Photography appears on 1,271 profiles, which represents 28.6% of all vendor profiles. Planning follows at 21.4%, Decor at 14.8% and Catering at 14.2%. Together, those four categories account for 57.9% of all vendor-service assignments.
The table below compares incidence on each side. Because one record can contain several services, percentages overlap and do not add to 100%.
| Service | Requests selecting service | Share of requests | Vendor profiles listing service | Share of vendor profiles |
|---|---|---|---|---|
| Venue | 890 | 66.5% | 164 | 3.7% |
| Decor | 769 | 57.4% | 655 | 14.8% |
| Photographer | 600 | 44.8% | 1,271 | 28.6% |
| Videographer | 564 | 42.1% | 308 | 6.9% |
| DJ | 542 | 40.5% | 382 | 8.6% |
| MC | 496 | 37.0% | 84 | 1.9% |
| Caterer | 485 | 36.2% | 630 | 14.2% |
| Lighting | 433 | 32.3% | 70 | 1.6% |
| Rentals | 395 | 29.5% | 162 | 3.7% |
| Ushers | 379 | 28.3% | 53 | 1.2% |
| Cake | 372 | 27.8% | 397 | 8.9% |
| Makeup | 357 | 26.7% | 163 | 3.7% |
| Planner | 339 | 25.3% | 948 | 21.4% |
| Security | 321 | 24.0% | 30 | 0.7% |
| Hair | 304 | 22.7% | 81 | 1.8% |
| Car Hire | 303 | 22.6% | 19 | 0.4% |
| Band | 249 | 18.6% | 54 | 1.2% |
| Stationery / Printing | 202 | 15.1% | 98 | 2.2% |
| Attire & Styling | 201 | 15.0% | 422 | 9.5% |
| Drinks & Bar | 198 | 14.8% | 32 | 0.7% |
| Alaga/Alaga Ijoko | 164 | 12.2% | 30 | 0.7% |
The cumulative table preserves the full request history. However, the request form gained categories during the observation period and retired the legacy “Others” option. To give every current category comparable exposure, Figure 4 uses the 936 requests posted from 1 April to 2 September 2026, after all 21 current service options appeared.
The chart does not say that 164 venue profiles can handle 890 venue requests. Dates, service areas, capacity, price points and response decisions all intervene. Still, it reveals where the two sides of the platform place their attention.
A representation index reveals the sharpest category mismatches
Raw percentages answer one question: how often does a category appear on each type of record? To compare the overall mixes fairly, we also calculated a relative representation index.
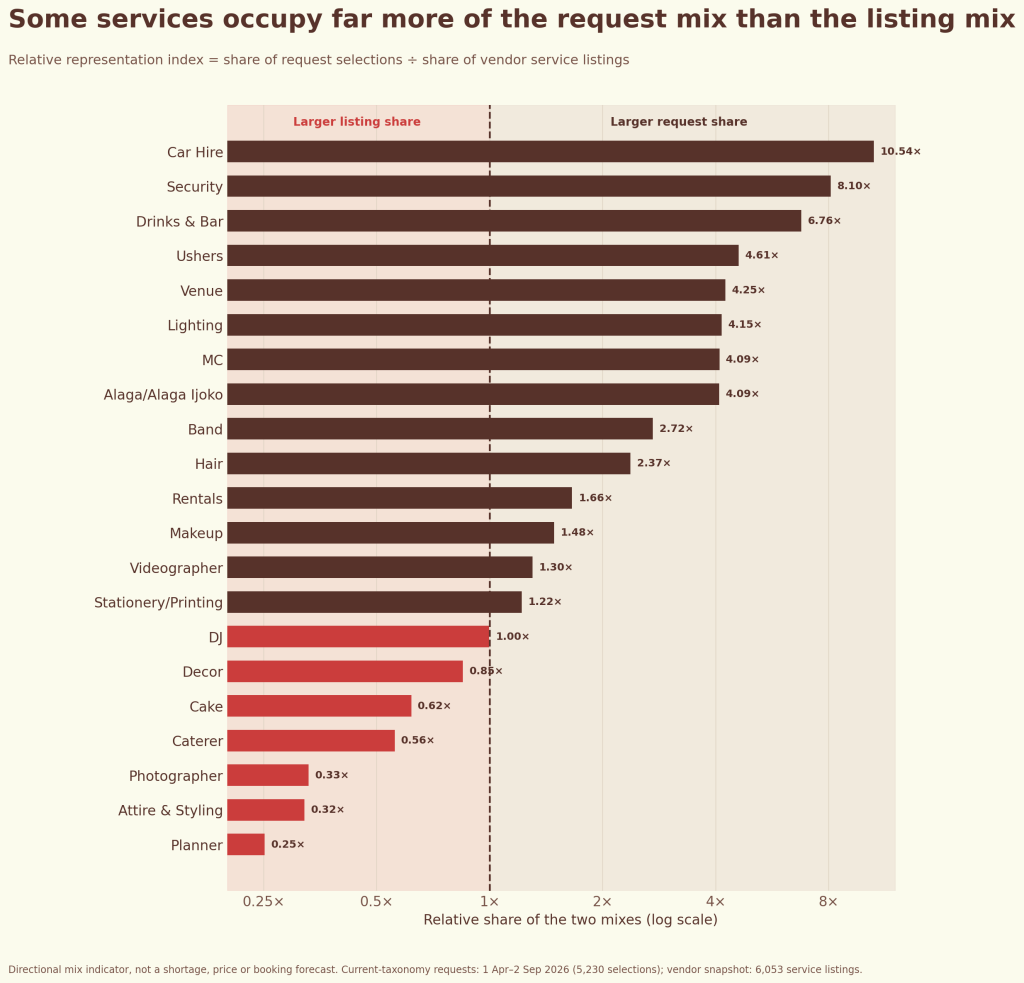
The index divides each category’s share of current-taxonomy request selections by its share of vendor-service assignments. It compares 5,230 selections across the 936 requests posted from 1 April onward with 6,053 service listings across the vendor profiles. An index of 1.0 means a service holds the same relative share on both sides; a value above 1.0 means it occupies more of the request mix; a value below 1.0 means it occupies more of the vendor-listing mix.
Car Hire produces the highest index at 10.54×. Security follows at 8.10×, Drinks & Bar at 6.76×, Ushers at 4.61×, Venue at 4.25×, Lighting at 4.15×, and MC and Alaga/Alaga Ijoko at 4.09× each. These figures identify categories that appear lightly in listed supply relative to their place in expressed demand.
At the other end, Planner records 0.25×, Attire & Styling 0.32× and Photographer 0.33×. Those values do not mean that requesters lack interest in those services. Photography appears in 362 current-window requests, and Planning appears in 206. The lower index simply says that those services command a much larger share of vendor listings than of request selections.
DJ sits almost perfectly at 1.00×, which makes it the closest category-mix balance in this snapshot.
| Higher representation in request mix | Index | Higher representation in vendor mix | Index |
|---|---|---|---|
| Car Hire | 10.54× | Planner | 0.25× |
| Security | 8.10× | Attire & Styling | 0.32× |
| Drinks & Bar | 6.76× | Photographer | 0.33× |
| Ushers | 4.61× | Caterer | 0.56× |
| Venue | 4.25× | Cake | 0.62× |
| Lighting | 4.15× | Decor | 0.85× |
| MC | 4.09× | DJ | 1.00× |
| Alaga/Alaga Ijoko | 4.09× | Videographer | 1.30× |
Treat this index as a recruitment and positioning signal, not a promise of commercial success. A high value cannot guarantee that a vendor will win work, and a low value cannot measure quality or profitability. The calculation compares category mix rather than live capacity.
Service pairs point to stronger packages and partnerships
Many requesters source services in natural groups. Photography and Videography appear together in 545 requests, or 40.7% of all requests. Decor and Venue follow almost level at 544, while DJ and MC occur together in 426.
The vendor side tells us how often one profile lists both services. Photography and Videography share 255 profiles, which makes a genuine combined media offer relatively common. Decor and Venue share only 16 profiles, DJ and MC share 25, and Decor and Lighting share 10.
Those differences suggest two practical responses. A business that already delivers both closely related services can present the combination clearly on its profile. When distinct specialists normally handle the work, referral relationships and coordinated proposals can help each business respond to the same broader brief without pretending to offer what it does not deliver.
| Service pair | Requests containing both | Share of requests | Profiles listing both |
|---|---|---|---|
| Photographer + Videographer | 545 | 40.7% | 255 |
| Decor + Venue | 544 | 40.6% | 16 |
| DJ + MC | 426 | 31.8% | 25 |
| Decor + Lighting | 401 | 29.9% | 10 |
| Decor + Rentals | 349 | 26.1% | 63 |
| Cake + Caterer | 278 | 20.8% | 154 |
| Decor + Planner | 275 | 20.5% | 323 |
| Hair + Makeup | 254 | 19.0% | 41 |
| Security + Ushers | 232 | 17.3% | 3 |
| Caterer + Drinks & Bar | 153 | 11.4% | 12 |
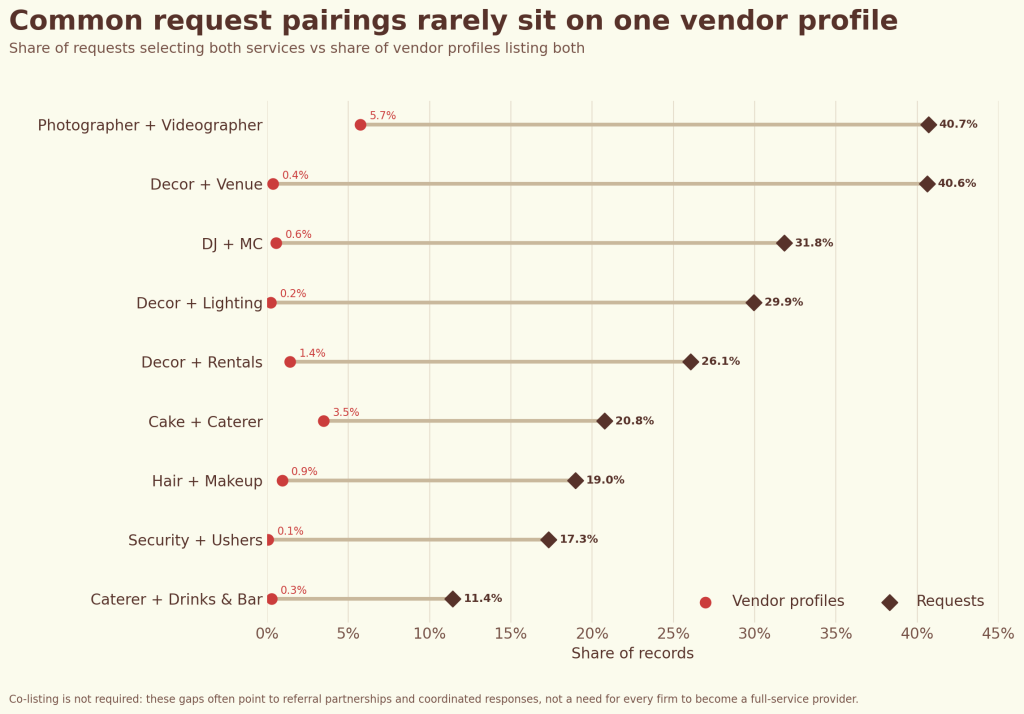
The comparison does not imply that one vendor should fulfil both parts. It measures services on the same request and services on the same profile. Independent businesses can answer the pattern through partnerships, recommendations or simply well-timed individual responses.
Venue works as the marketplace’s main gateway
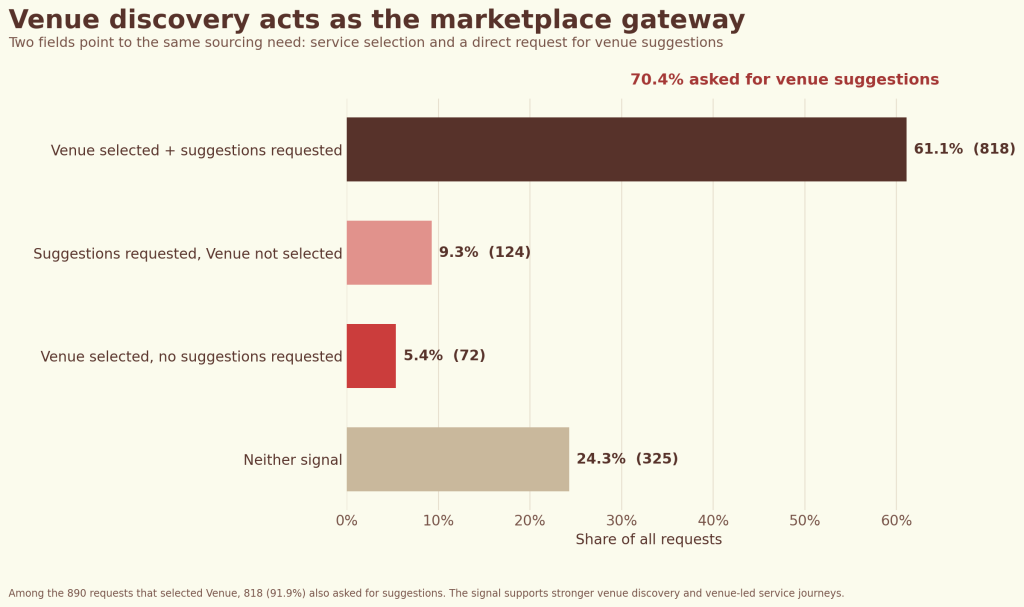
Venue deserves special attention because two different request fields point in the same direction. Requesters selected Venue in 890 records, and 942 records—70.4% of all requests—asked for venue suggestions. Among those who selected Venue, 818, or 91.9%, also welcomed suggestions.
Standalone behaviour reinforces the signal. Venue accounts for 242 of the 411 single-service requests, which means it represents 58.9% of focused, one-category briefs.
For couples, a venue choice often sets the location, capacity, style, date and logistical boundaries for everything else. For vendors, that decision can open the next set of conversations around wedding decorators, wedding photographers, wedding videographers, wedding caterers and event rentals.
This gateway also gives the platform a clear navigation opportunity. A venue page can lead users into the services that commonly follow venue discovery, while complementary vendors can build useful location-specific resources instead of relying only on broad category pages.
Demand concentrates more tightly than vendor primary bases
Vendor profiles span all 36 states plus the FCT in this snapshot. Requests cover 30 states plus Abuja, yet their distribution clusters much more strongly in a few markets.
Lagos contributes 599 requests, or 44.7%, against 1,440 vendor primary bases, or 32.5%. Abuja holds 13.3% of requests and 6.6% of vendor bases. Rivers accounts for 6.3% of requests and 3.7% of bases. Together, Lagos, Abuja and Rivers hold 64.4% of requests but 42.8% of vendor primary bases.
| State or market | Requests | Request share | Vendor primary bases | Vendor share | Geographic representation index |
|---|---|---|---|---|---|
| Lagos | 599 | 44.7% | 1,440 | 32.5% | 1.38× |
| Abuja/FCT | 178 | 13.3% | 293 | 6.6% | 2.01× |
| Rivers | 85 | 6.3% | 166 | 3.7% | 1.70× |
| Ogun | 72 | 5.4% | 268 | 6.0% | 0.89× |
| Oyo | 62 | 4.6% | 262 | 5.9% | 0.78× |
| Delta | 43 | 3.2% | 175 | 3.9% | 0.81× |
| Imo | 29 | 2.2% | 89 | 2.0% | 1.08× |
| Cross River | 18 | 1.3% | 53 | 1.2% | 1.13× |
Geography needs a careful reading. We assigned one primary base to each vendor profile from its business-location text. That method does not capture every area a vendor serves, and some providers travel across state boundaries. Request location describes the event need, while vendor location describes a base rather than a guaranteed service radius.
Even with that limitation, the concentration matters. Vendors who genuinely serve Lagos can strengthen discovery through the wedding vendors in Lagos State directory, while Abuja-based requesters can explore wedding vendors in the FCT. Anyone planning outside those hubs can browse wedding vendors by state or search more locally through the city directory.
Local category pressure becomes clearer inside major markets
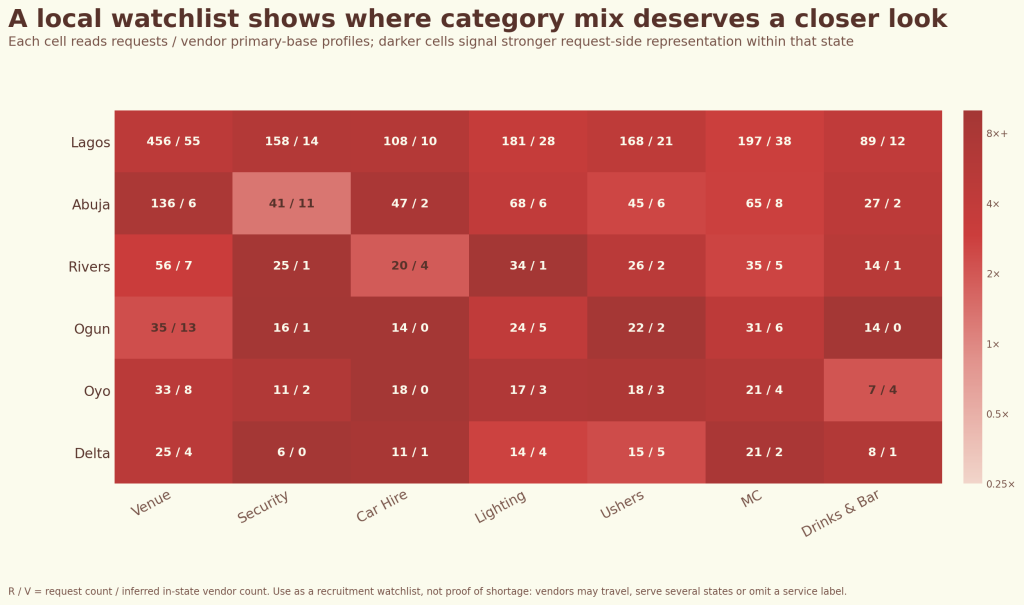
National category averages can hide local mismatches. The state-and-service comparison highlights several combinations with enough records to merit attention:
- Lagos records 456 Venue requests against 55 profiles that list Venue with Lagos as their primary base.
- Abuja records 136 Venue requests against six FCT-based Venue profiles.
- Lagos records 158 Security requests against 14 Lagos-based Security profiles.
- Lagos records 108 Car Hire requests against 10 Lagos-based Car Hire profiles.
- Abuja records 68 Lighting requests against six FCT-based Lighting profiles.
- Rivers records 56 Venue requests against seven Rivers-based Venue profiles.
These counts can guide vendor recruitment, category education and local content. They cannot establish that only those businesses serve each market. Travelling vendors, incomplete service fields, changing availability and unlisted providers can all expand the real pool.
The most useful next step does not involve declaring a city “best” or a category “guaranteed.” Instead, the data can tell the platform where it should deepen relevant listings and tell vendors where they should test a genuine, serviceable expansion.
Flexible budget means a conversation, not zero spending
The budget field needs one crucial interpretation: a total budget of zero means the requester chose “flexible.” It does not mean that the client wants the work for free, has no money or forgot to enter a value.
Across all 1,339 requests, 366 use a flexible budget, 968 state a positive fixed amount and five contain no usable total. Flexible requests therefore represent 27.3% of the full set.
Among fixed-budget requests, the median stands at ₦2 million. The middle half runs from ₦600,000 to ₦4 million, while the distribution stretches from small single-service briefs to broad multi-provider events. More than one in four requesters choosing flexibility gives vendors room to propose a scope before anchoring the conversation to a price.
| Fixed total budget band | Requests | Share of fixed-budget requests |
|---|---|---|
| Under ₦500,000 | 172 | 17.8% |
| ₦500,000–₦999,999 | 130 | 13.4% |
| ₦1,000,000–₦1,999,999 | 151 | 15.6% |
| ₦2,000,000–₦2,999,999 | 134 | 13.8% |
| ₦3,000,000–₦4,999,999 | 173 | 17.9% |
| ₦5,000,000–₦9,999,999 | 155 | 16.0% |
| ₦10,000,000+ | 53 | 5.5% |
Adding the positive fixed totals produces ₦2.793 billion in stated request budgets. That number describes intended budgets for selected scopes; it does not describe confirmed spend, completed transactions, platform revenue or vendor earnings. Marriage In Nigeria does not participate in the underlying vendor-client payments, so the data cannot show how much the parties eventually agree or pay.
Scope tracks stated budget more closely than guest count
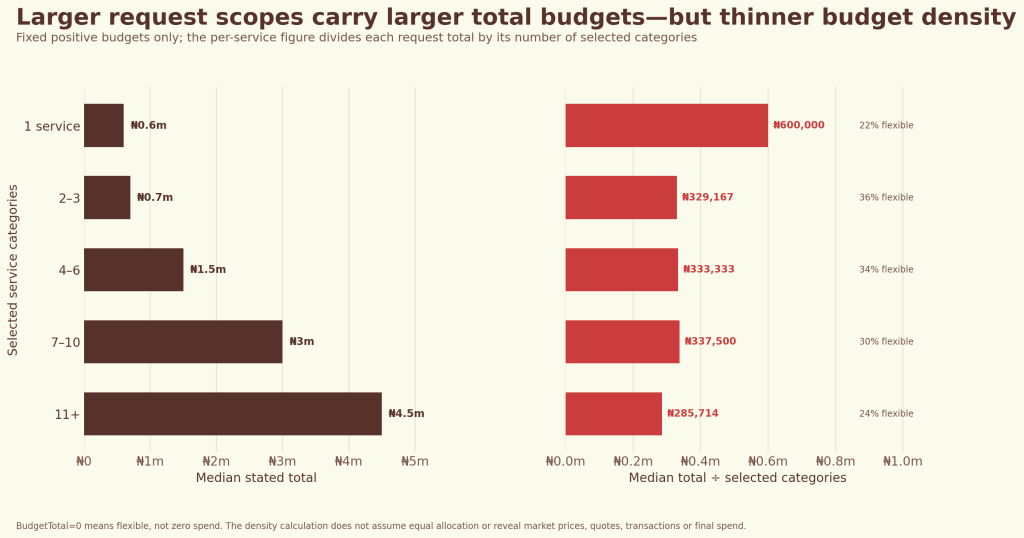
Across the chosen scope bands, median fixed budgets generally increase as requests cover more categories. One-service requests record a median fixed total of ₦600,000. The median reaches ₦700,000 for two to three services, ₦1.5 million for four to six, ₦3 million for seven to ten and ₦4.5 million for 11 or more.
A robust rank-correlation check supports the same reading. Among 937 records with plausible guest counts and positive fixed budgets up to ₦20 million, the relationship between total budget and services requested reaches 0.66. Budget and guest count show a much weaker 0.19 relationship.
In plain language, the breadth of the brief appears to shape the stated total more strongly than headcount alone. That finding makes sense because a 200-guest request for one venue differs fundamentally from a 200-guest request that also covers food, decor, photography, entertainment, styling, transport and event support.
The median usable guest count is 200, with the middle half ranging from 150 to 300. Even so, vendors should quote the actual scope, quantities, date and location instead of treating the median guest count or total budget as a standard market price.
The figures cannot support a per-service price list. Each total can cover a different mix, and only a small subset entered detailed category amounts. Couples should request itemised proposals; vendors should explain what each tier includes and excludes.
Dates create a second layer of supply pressure
Category and geography only describe part of a match. A vendor must also have room on the event date.
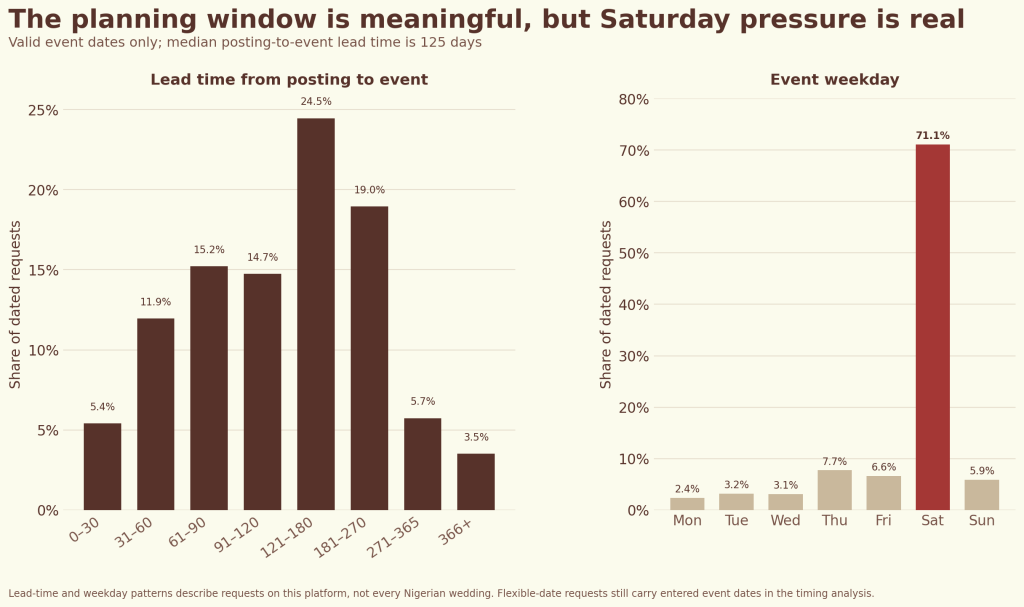
Among usable dated requests, the median posting-to-event lead time reaches 125 days, or just over four months. The middle half spans roughly 78 to 188 days. The export marks 709 requests as date-flexible, but form defaults changed during the observation window, so we do not treat that cumulative share as a stable planning preference.
Saturday dominates the dated pipeline with 892 of 1,255 usable event dates (71.1%). Yet 363 dates fall on other weekdays, so vendors should not ignore Friday, Sunday or midweek availability. A broad vendor count can therefore hide tight Saturday capacity even when a category looks well represented overall.
Response timing adds urgency. Valid request windows remain open for a median of 30 days, but 245 close within seven days. A vendor who prepares service-specific portfolios, qualifying questions and clear opening messages can judge and answer a suitable request faster.
These timing figures describe the current Marriage In Nigeria request pipeline, not every Nigerian wedding. The observation period covers about one year, and requests for future event months receive different amounts of time to enter the dataset.
What couples and planners can do with these insights
1. Describe the whole brief, then mark the priorities
A multi-service request can save time, but a long checklist works best when vendors can see the essentials. Identify the must-have services, preferred style, event location, date status and practical constraints. Add useful quantities such as guest count, hours, coverage areas or equipment needs where they apply.
2. Treat “flexible” as permission to discuss value
Choose a flexible budget when you genuinely want the market to help shape scope. Vendors still need enough context to propose an appropriate option, so explain what matters most and ask for inclusions, exclusions and alternatives. If you already know your ceiling, state a realistic range rather than forcing every provider to guess.
3. Resolve the venue question early
Venue affects capacity, access, power, parking, logistics, decor rules and vendor setup time. If you need suggestions, say so clearly. You can also start with the wedding venue directory and use the result to narrow the rest of the brief.
4. Compare specialists on the right evidence
Review portfolios that match your event type and size. Ask each provider about availability, scope, travel, substitutions, overtime, cancellation terms and payment milestones. A profile or contact label can help discovery, but it does not replace your own checks.
5. Put every agreement in writing
Marriage In Nigeria introduces the parties; it does not manage the wedding-service transaction. Confirm deliverables, deadlines, fees, refund terms and responsibilities directly with each vendor before you pay. The platform’s responsible connection guidance offers additional context.
6. Keep alternatives for date-sensitive categories
Saturday demand can narrow availability quickly. Shortlist more than one suitable provider, especially for venues, media teams and other services that can only support a limited number of simultaneous events. A flexible date may widen your options, but only move it when the wider event plan allows.
What wedding vendors can do with these insights
1. Make the profile taxonomy accurate
Select every service that the business genuinely offers, and remove categories that no longer fit. Clear service labels improve matching, while strong portfolio examples help a requester understand the actual offer. Vendors can list a wedding business or review an existing profile for gaps.
2. Read high-index categories as testable signals
Car Hire, Security, Ushers, Lighting, MC and Venue show strong request-side representation in this edition. A vendor should only act on that signal when the business can deliver the service, geography and dates well. The index invites research and targeted positioning; it does not justify a blind expansion.
3. Build partnerships around repeated co-demand
Photo/video and hair/makeup can support clear combined offers when one business truly provides both. Decor/venue, DJ/MC, decor/lighting and security/ushers often suit referral or production partnerships. Agree roles, introductions and hand-offs before a live request arrives.
4. Respond to the brief rather than sending a generic advert
Use the request’s services, location, date, guest count, contact preference and response window to judge fit. Lead with the relevant proof, ask only necessary questions and state the next step. Respect a requester’s contact instructions, and stop outreach when the window closes or the requester asks.
5. Turn flexible budgets into structured choices
A flexible budget does not mean unlimited spend. Offer two or three sensible scopes, state what changes between them and connect each amount to an outcome. This approach gives the requester a real basis for comparison without hiding necessary costs.
6. Choose contact access intentionally
Review the public details before you unlock a request. Check that the service, place, date and scale suit the business, then compare a single unlock with the current package options. Remember that access remains non-exclusive and cannot guarantee a response; the live pricing page always holds the current terms.
7. Strengthen local discovery without overstating reach
Keep the primary base and genuine service areas current. Location-specific pages can help a relevant client find the business, but a broad claim creates poor-fit enquiries when travel, crew or transport costs make the job impractical.
What the data suggests for the marketplace
This comparison also highlights several product and editorial opportunities for Marriage In Nigeria.
First, the platform can recruit and activate vendors in services that occupy a larger share of requests than listings. Local evidence should guide that work: Abuja Venue, Lagos Security, Lagos Car Hire and Rivers Venue offer stronger targets than a generic nationwide appeal.
Next, venue discovery can act as a planning hub. The platform can link venue searches to Decor, Catering, Photography, Videography, DJ, MC, Lighting and Rentals, then help requesters carry their location and date context into the next step.
Partnership guidance can address the bundle mismatch. Vendor education around referrals, joint proposals and honest multi-service profiles would help specialists serve broad requests without forcing every company into a full-service model.
Finally, each refresh should compare both cumulative structure and recent behaviour. Vendor profiles persist, requests expire, and the platform has changed some category and form options during the observation window. A dated index keeps the report useful without presenting old patterns as permanent truths.
How we calculated the figures
This edition uses a platform snapshot dated 2 September 2026. The vendor population contains 4,437 profiles, and the request population contains 1,339 unique records posted from 10 September 2025 to 2 September 2026.
We used the following rules:
- We counted a service once per vendor profile or request, then allowed different services on the same record to contribute separately. Service totals therefore exceed profile and request totals.
- We treated a recorded total of ₦0 as flexible, not zero spending. Fixed-budget statistics use only the 968 positive totals; five missing totals remain separate.
- We matched 21 named categories across both sides. For the relative representation index, we used the 936 requests posted from 1 April 2026 onward, when every current category appeared and the legacy request-only “Others” option had disappeared.
- We inferred one primary state or FCT base from each vendor’s free-text business location. This field does not describe every place that vendor may serve.
- We excluded unknown or invalid event dates from date-based measures. Calendar percentages use 1,255 chronological dated requests rather than all 1,339 records.
- We excluded zero guest counts and one technical sentinel from guest statistics. The usable guest-count denominator equals 1,275.
- We used medians and interquartile ranges for skewed budgets and guest counts because a few very large values can distort an average.
- We kept private names, phone numbers, email addresses, attachments, tokens, exact addresses and free-text request details out of every calculation shown here.
Some categories entered the request form later than others, and the platform’s acquisition and onboarding activity also shapes which profiles appear in each category or location. The results therefore describe listed presence and expressed interest on Marriage In Nigeria; they do not form a census of Nigeria’s wedding industry.
Live totals may differ by the time you read this article. New profiles and requests can arrive, while requesters can close briefs and the platform can update records. Visit the live vendor directory and current wedding vendor requests for today’s marketplace view.
Limits to keep in mind
- A listing does not equal live capacity. The vendor may already have a booking, decline a location or decide not to unlock a request.
- Posted requests do not equal bookings. Each one expresses interest and scope before independent vetting, negotiation and agreement.
- The index measures relative mix. It cannot predict price, response rate, conversion, quality, revenue or profitability.
- Several vendors can access one request. Contact access does not grant exclusivity or guarantee a reply.
- Location remains approximate. Vendor primary base does not capture every travel or service area.
- Budgets express intent. Flexible means open to discussion, while fixed totals can change during direct negotiation.
- The snapshot reflects one platform. It cannot support national market-share or all-industry claims.
The key disclaimer is simple: these figures describe profiles listed and needs expressed on Marriage In Nigeria. They do not measure completed bookings, vendor revenue or the value of transactions. Vendors and requesters communicate and transact independently, and Marriage In Nigeria does not participate in their agreements or payments.
Frequently asked questions
What does wedding vendor supply and demand mean in this report?
Supply means the services that vendor profiles list on Marriage In Nigeria. Demand means the services that requesters select in posted briefs. Neither measure captures every Nigerian vendor or wedding, and neither proves availability or a completed booking.
Does a flexible budget mean the requester has no budget?
No. In this analysis, a zero total marks the platform’s flexible-budget option. We keep those 366 requests separate from positive fixed budgets and from the five records with missing totals.
Does a high representation index guarantee more jobs?
No. A high index only shows that a service occupies a larger share of request selections than vendor-service listings. Location, date, quality, price, fit, response choices and competition still shape every opportunity.
Do all vendors pay to appear on Marriage In Nigeria?
No. The platform offers a free starting profile, and couples can discover vendors through the public directory. Vendors who want to initiate contact from a posted request can pay for a single unlock or timed package, while an eligible Gold access period can also provide access. Check the pricing page for current options.
Does request access guarantee an exclusive opportunity?
No. More than one eligible vendor may access the same request. Payment grants qualifying contact access under the current terms; it does not guarantee exclusivity, a response, a booking or payment from the client.
Does Marriage In Nigeria handle the vendor-client payment?
No. Vendors contact requesters directly through WhatsApp or email after qualifying access. The parties independently agree the service scope and handle their own wedding-service payments; Marriage In Nigeria stays outside that transaction.
Why do the service percentages add to more than 100%?
Each vendor profile can list several services, and each request can select several categories. Percentages describe the share of records containing each service, so categories overlap by design.
Are all 1,339 requests still open?
No. The total provides a cumulative analytical population for this edition. Request status, response deadlines and event dates change over time, so readers should use the live requests page when looking for current opportunities.
The clearest opportunity lies in better matching
Marriage In Nigeria already brings substantial supply and expressed demand into one place. The deeper opportunity does not come from chasing the largest raw category. It comes from matching the right service, place, date, scope and expectations more precisely.
For couples and planners, that means writing a useful brief, comparing relevant specialists and completing independent checks before an agreement. For vendors, it means maintaining an accurate profile, choosing requests carefully, responding with context and building relationships around services that clients often source together.
The data will change, but the central lesson should remain useful: a healthy wedding marketplace needs more than many profiles and many requests. It needs enough relevant choices at the moment and place where a real celebration takes shape.
Ready to act on the latest marketplace? Post a wedding vendor request, browse wedding vendors, or list your wedding business.